Stencils is a product promotion tool. You pay only for clicks when customers open your PDP from the promotional position.
With stencils, you can:
- increase the PDP reach by an average of 3.2 times according to Ozon data for the first half of 2023;
- show products to potential customers more often;
- highlight your products.
Promotions are displayed:
- On the search results and category pages, as well as in the promotional collections of products.
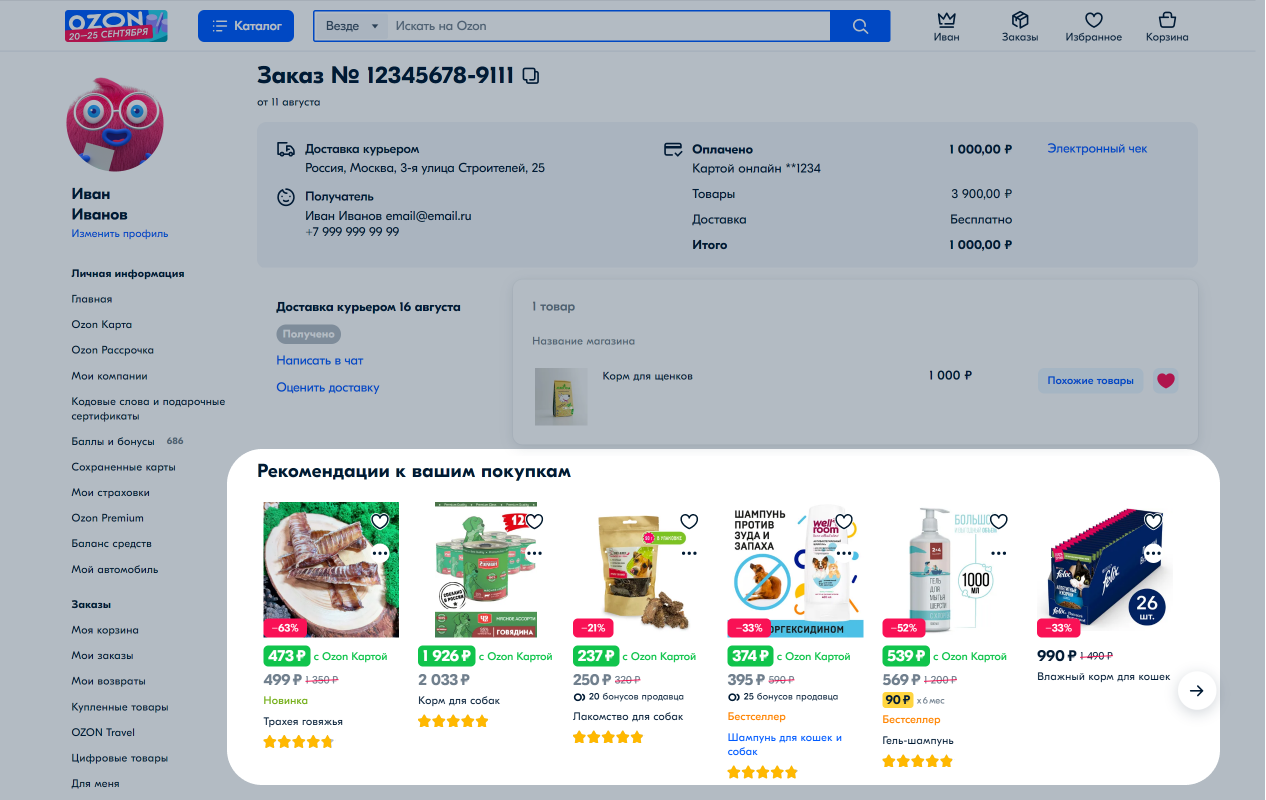
- On recommendation shelves:
- in PDPs;
- in the cart;
- on the order page on the website;
- after order payment;
- in reviews and questions in the app.
- On the top 12 positions in search results, categories, and on the pages of promotional product selections.
Launch promotion using stencils #
If you run into debt, we’ll suspend access to promotion tools and resume it when the balance is in surplus.
-
In the Promotion → Stencils section, click Create campaign.

-
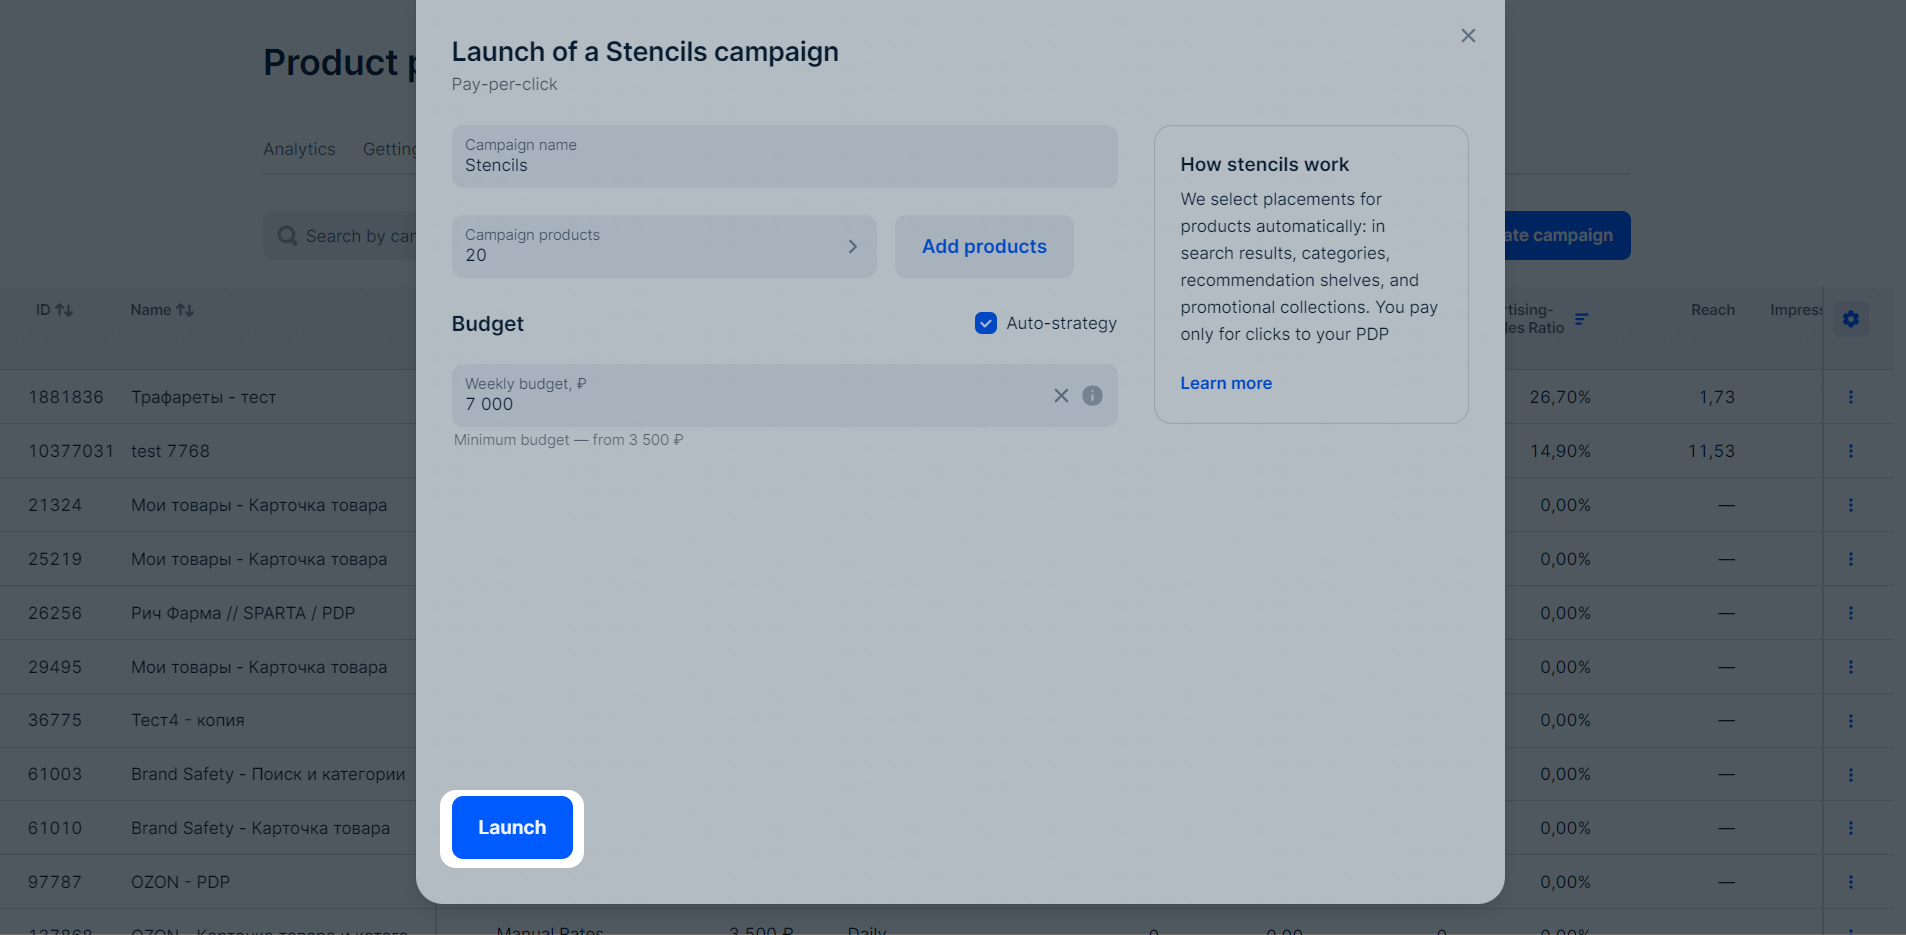
Enter the campaign name.
-
We automatically enable the Auto-strategy. The system takes into account the competition in the category and changes the rate to show the product as often as possible within the daily budget.
To monitor and change the rate manually, disable the auto-strategy. You can change the rate management strategy after launching the campaign.
Learn more about managing campaigns -
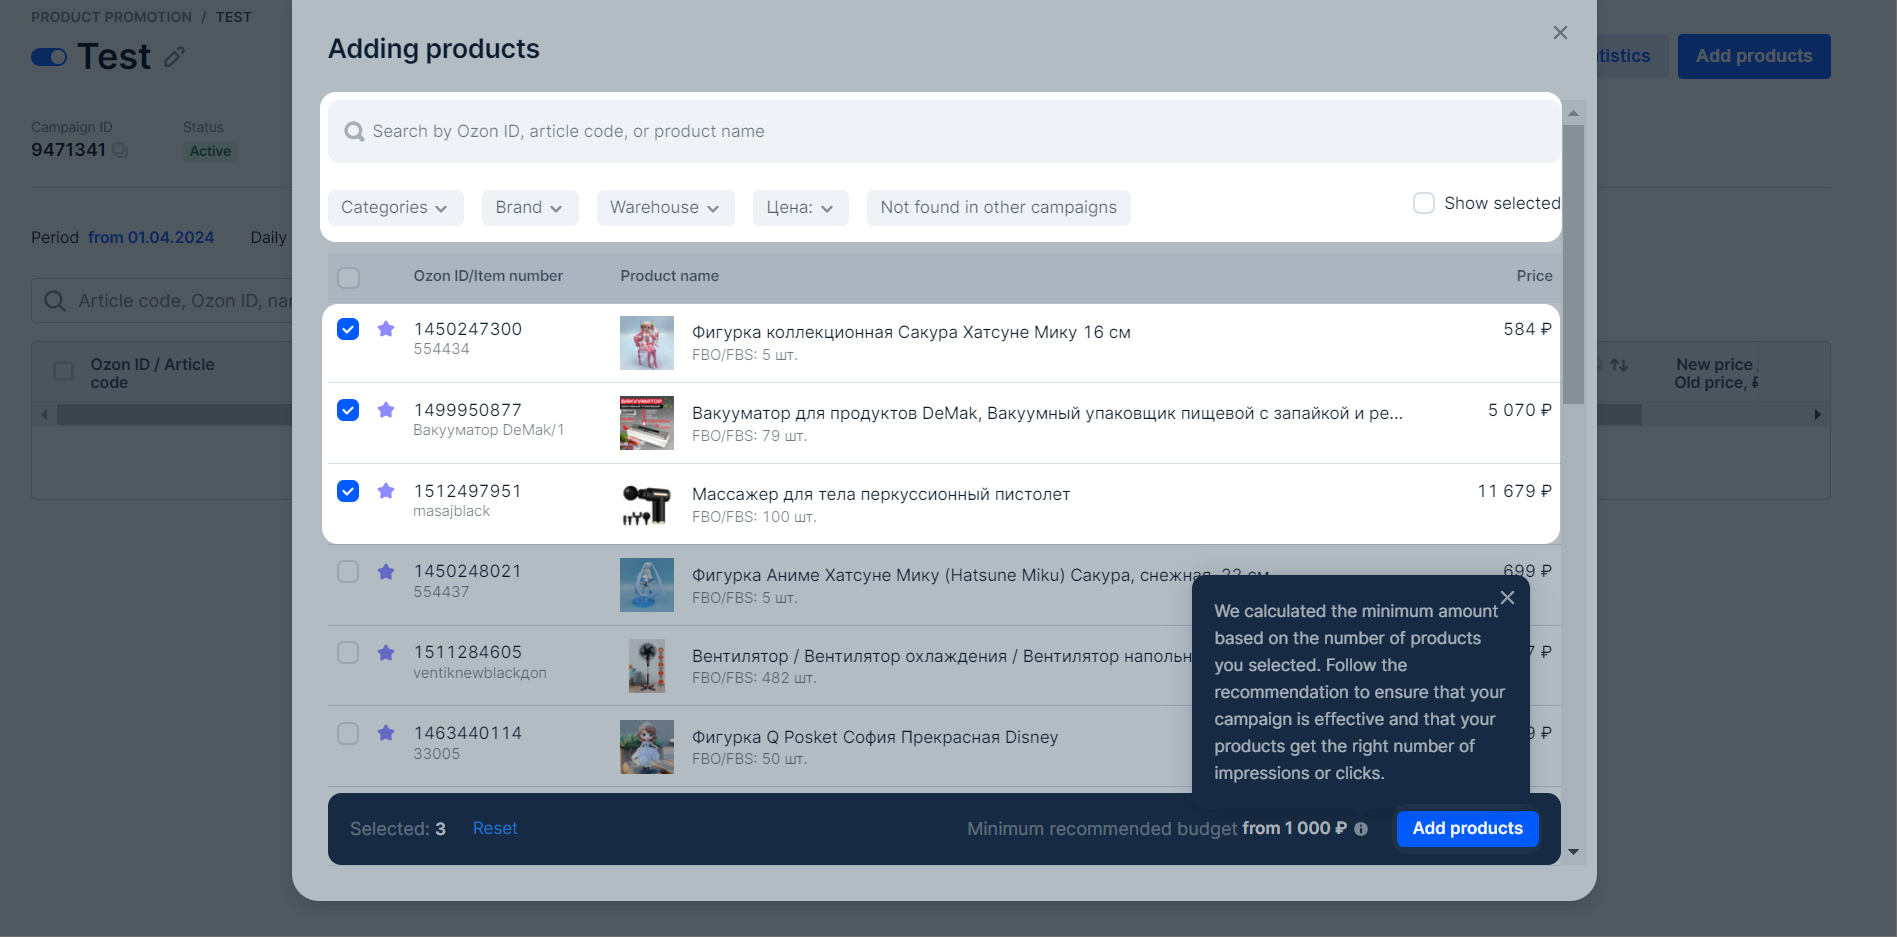
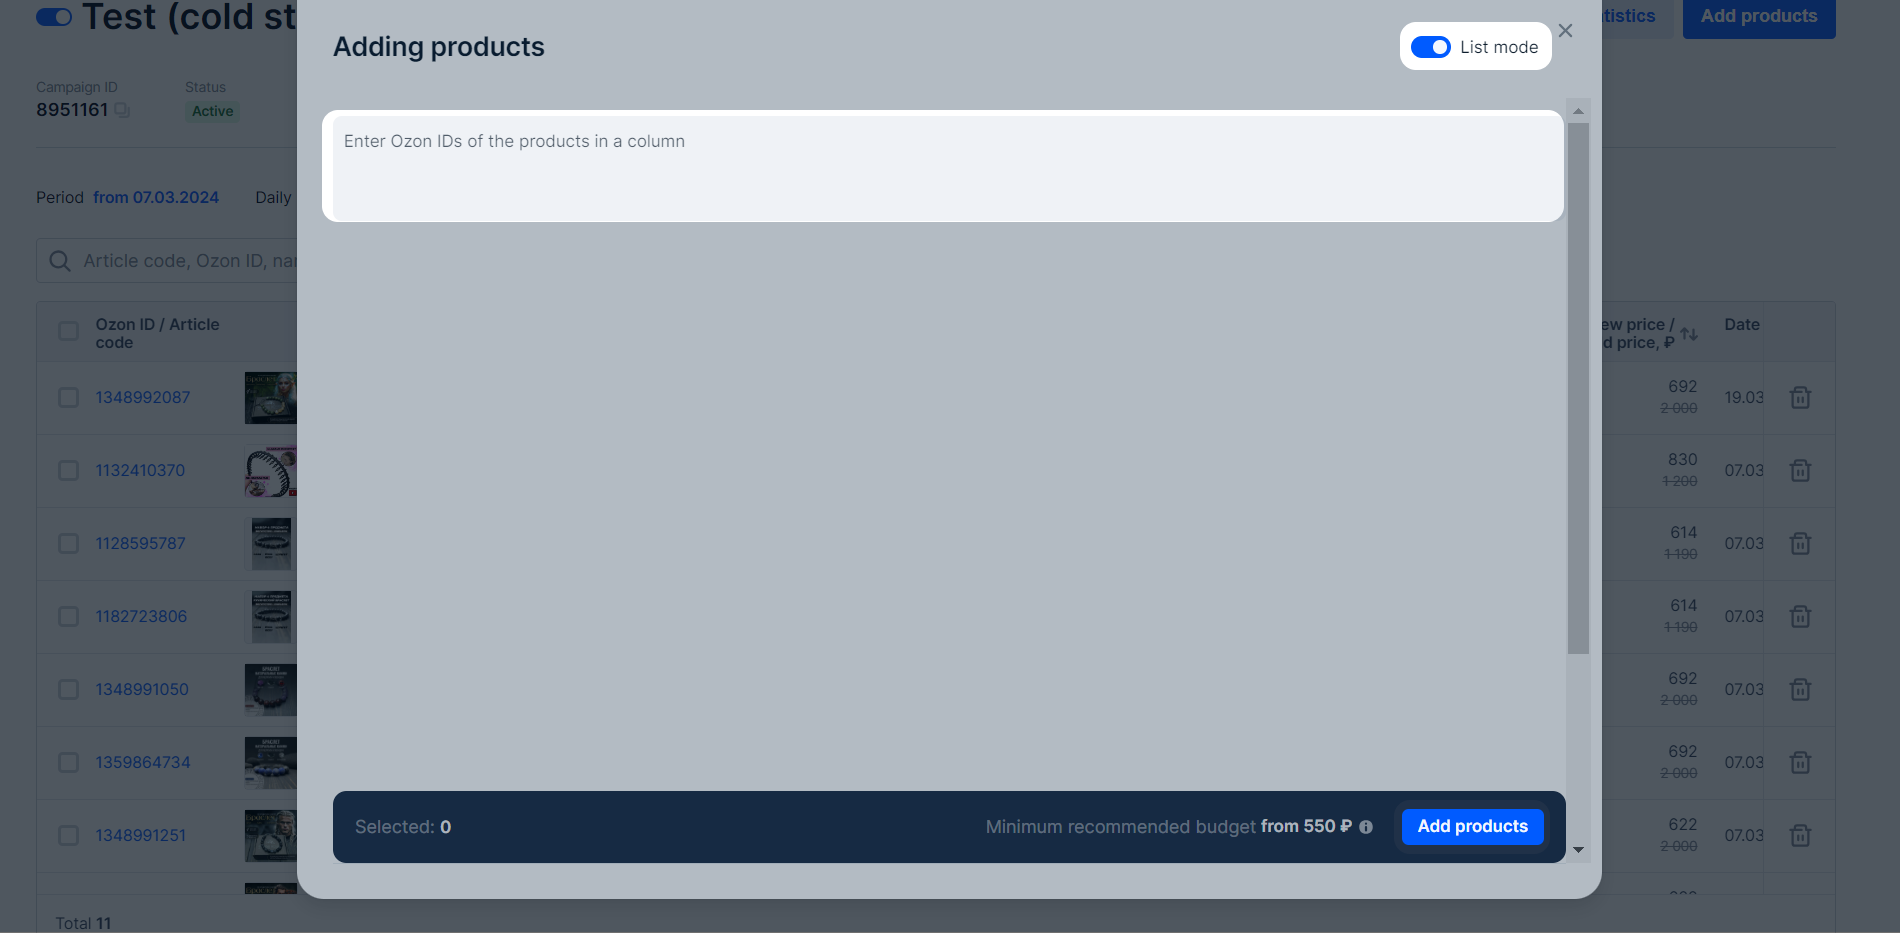
Click Add products. Select the products manually or add a list of article codes or IDs.
-
Set a weekly budget:
- from 3,500 rubles for a campaign with an auto-strategy enabled;
- from 7,000 rubles for a campaign with manual rate management.
You’ll see the recommended minimum budget for the amount of products you have. To make your promotion effective, set the value to at least the recommended one.
-
Specify the campaign period.
-
Click Launch.
Specify rate #
Starting from October 17, 2024, the minimum rates for products in “Stencils” campaigns increase to 7 RUB per click. For some categories, the rate remains the same or decreases. If the product rate is lower than 7 RUB per click, we increase it to the new minimum.
List of categories for which the rate decreases or remains the same (XLSX)
If the auto-strategy is enabled, you can’t change the rates. They’re set and adjusted automatically for each search query so that the product gets more clicks.
We’ll automatically set competitive rates for your products as soon as you add them to your campaign. To change them, go to Promotion → Stencils and open the campaign you need to adjust. Change the rate:
- for one product: set the necessary value in the Rate column;
- for multiple products: select products, click Set a rate, and specify the rate.
The minimum rate is 3 RUB per 1 click, but it may differ for some product categories and subcategories. You can see the rate when setting up the promotion in your personal account.
Product categories with a rate of over 3 RUB per click until October 17, 2024
| Product category | Minimum rate in rubles |
|---|---|
| Accessories | 3–3.5 |
| Car Products | 3–3.5 |
| Clothing | 3–3.5 |
| Construction & Renovation | 3–3.5 |
| Electronics Accessories | 3–3.5 |
| Furniture | 3–4.5 |
| Health & Beauty | 3–4 |
| Household Chemicals | 4–4.5 |
| House & Garden | 3–3.5 |
| Laptops & Computers | 3–4 |
| Pet Products | 3–5 |
| Pharmacy | 3–5 |
| Small Household Appliances | 3–3.5 |
| Smartphones & Tablets | 3–3.5 |
| Sports Clothing | 3–3.5 |
| Sports & Recreation Products | 3–4 |
The amounts are indicated with VAT. You can change the value at any time: after making changes, new rates will apply within 3 hours.
The Competitive rate column displays the rate with which you can get up to 50% of all possible impressions, based on the statistics of competitors' rates for the previous three days.
Learn more about choosing a rate and budget
Manage campaign #
Choose rate and budget #
The higher the rate, the more likely the customers will see your products in the highlighted positions. This way you’ll get first impressions faster. The real rate may be lower: the system will calculate the appropriate one depending on the display position and competitors' rates. It won’t be higher than the one you’ve set.
Besides the set rate, we take into account the PDP quality and other factors that affect the position in the search.
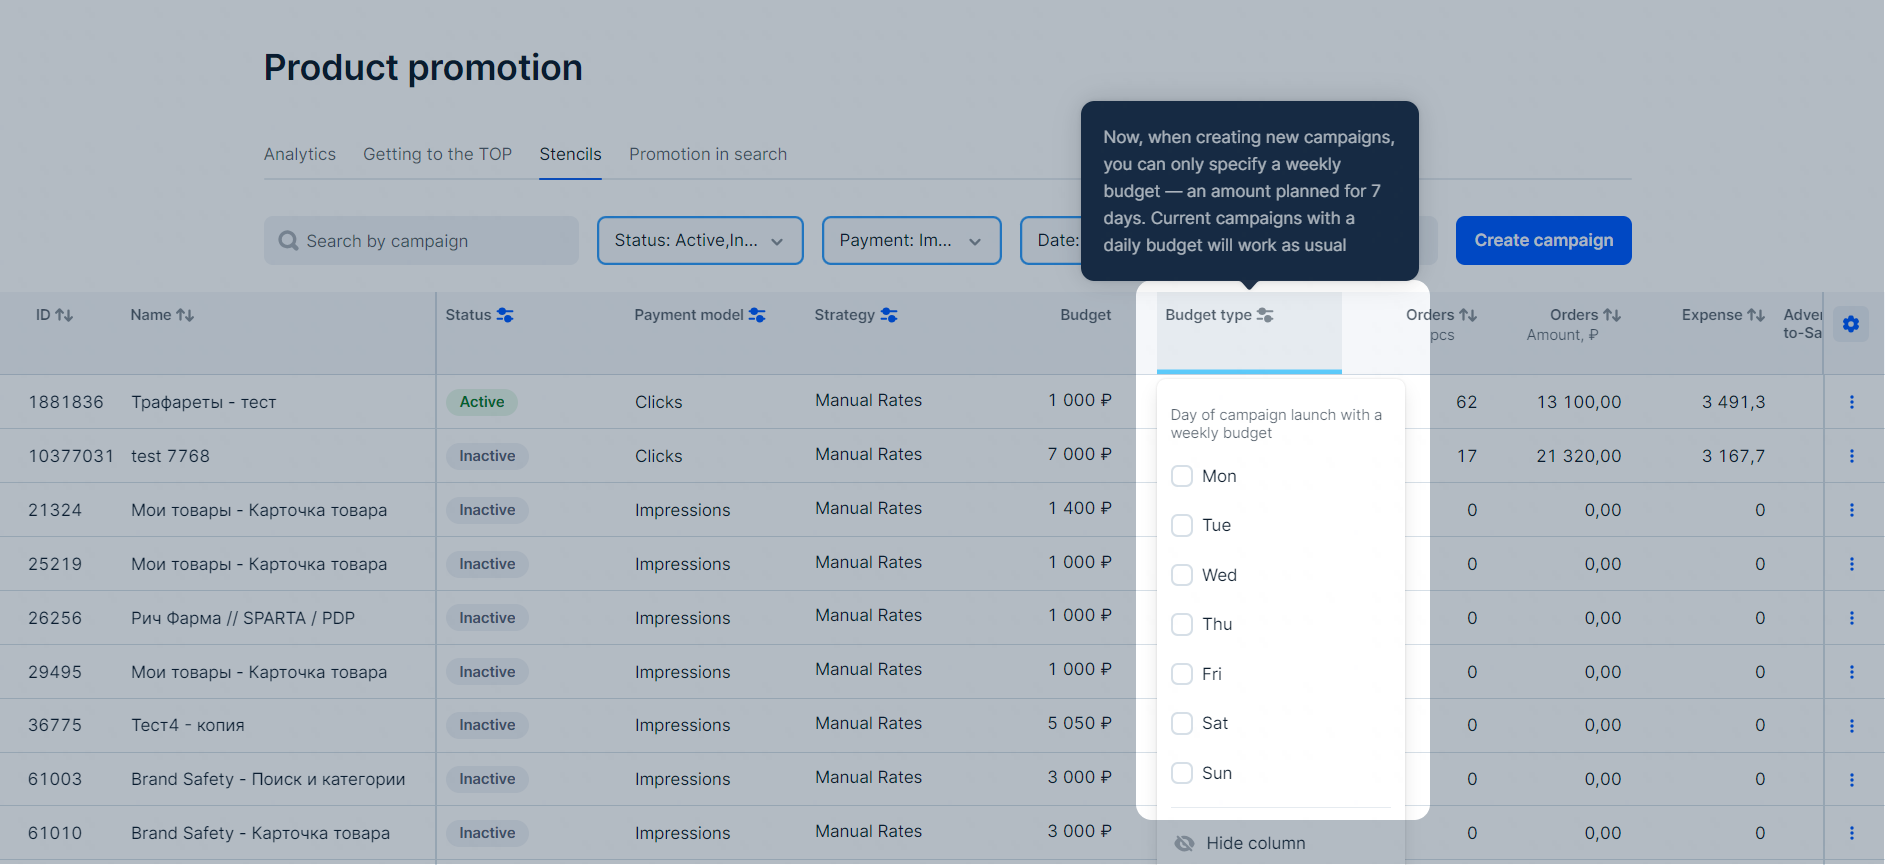
Weekly budget #
This is the amount you pay for promotion in 7 days. The period begins with the weekday when the campaign was created. You can’t set a random interval, even if you stop and restart the promotion in the middle or at the end of the period. For example, if you create a campaign on Wednesday, the budget will be spent until next Tuesday inclusive.
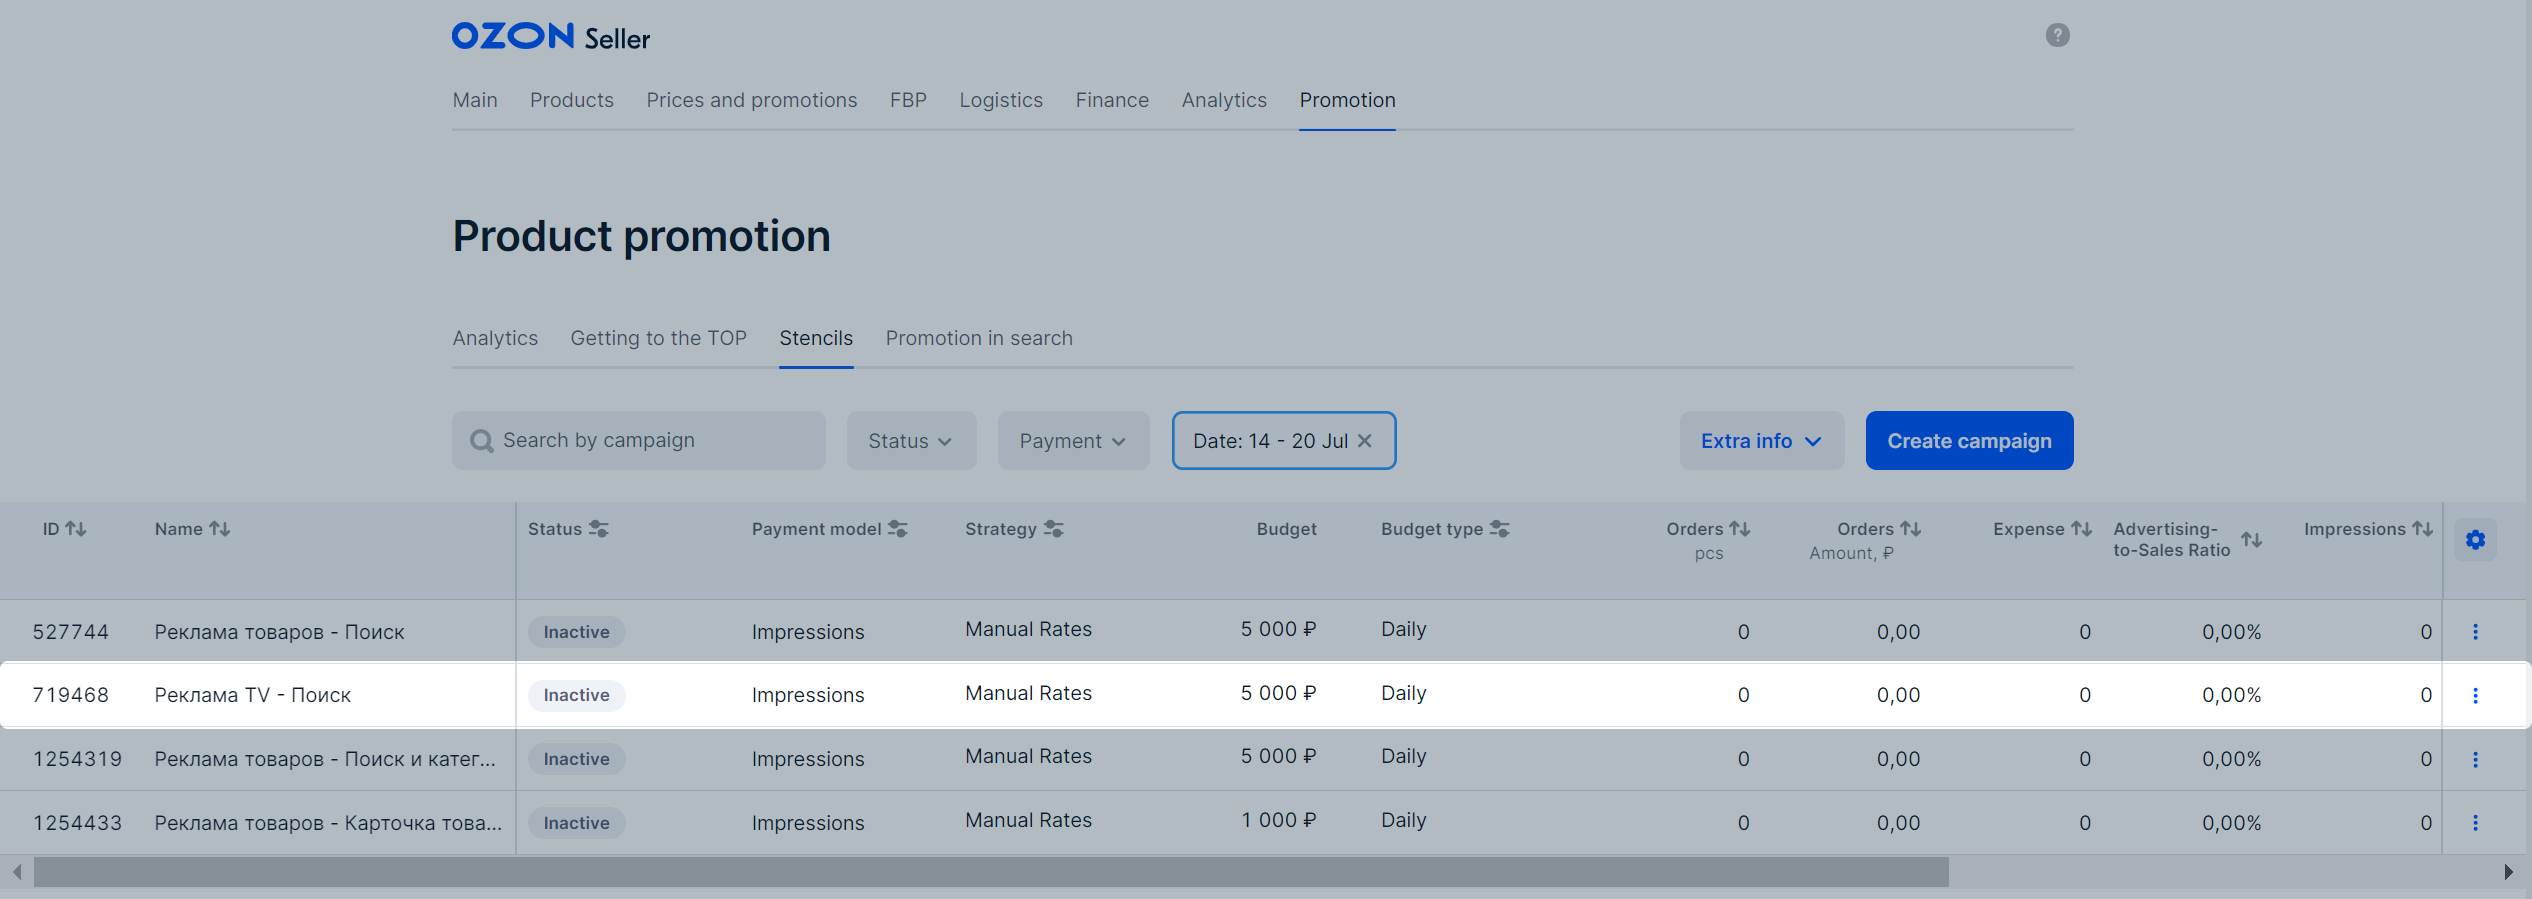
On the Promotion → Stencils page, click the budget amount for each campaign to view:
- the beginning and end days of the paid period;
- the amount spent;
- the balance of the budget and days in the current period.
Minimum weekly budget:
- 3,500 rubles for a campaign with an auto-strategy enabled;
- 7,000 rubles for a campaign with manual rate management.
The daily expense depends on the product demand, but doesn’t exceed 25% of the weekly budget, even if the campaign is running continuously. If you pause the promotion at the beginning or middle of its period and then restart it on the last day, the entire balance of the weekly budget may be spent.
Spending per day in campaigns with an auto-strategy can reach up to 50% of the remaining weekly budget, and the rates can be higher than average if you:
- pause and then restart promotion in an auto-strategy campaign in the middle or end of the period;
- change the strategy from manual rates to an auto-strategy in an already launched campaign.
To spend the budget more slowly, change the strategy at the beginning or at the end of the weekly period.
If the budget is spent in 7 days, we’ll pause the promotion until the beginning of a new period—the weekday when it was launched. If you don’t want to wait for next week, you can increase the campaign budget to extend it.
Sometimes the budget can be overspent. In this case, we adjust it at the end of the one-week period so you pay only the amount you’ve set in the campaign. The impressions collected in the campaign are preserved. The overspend amount is marked with a “-” sign in the product promotion report in the Adjustment field.
Learn more about downloading the report
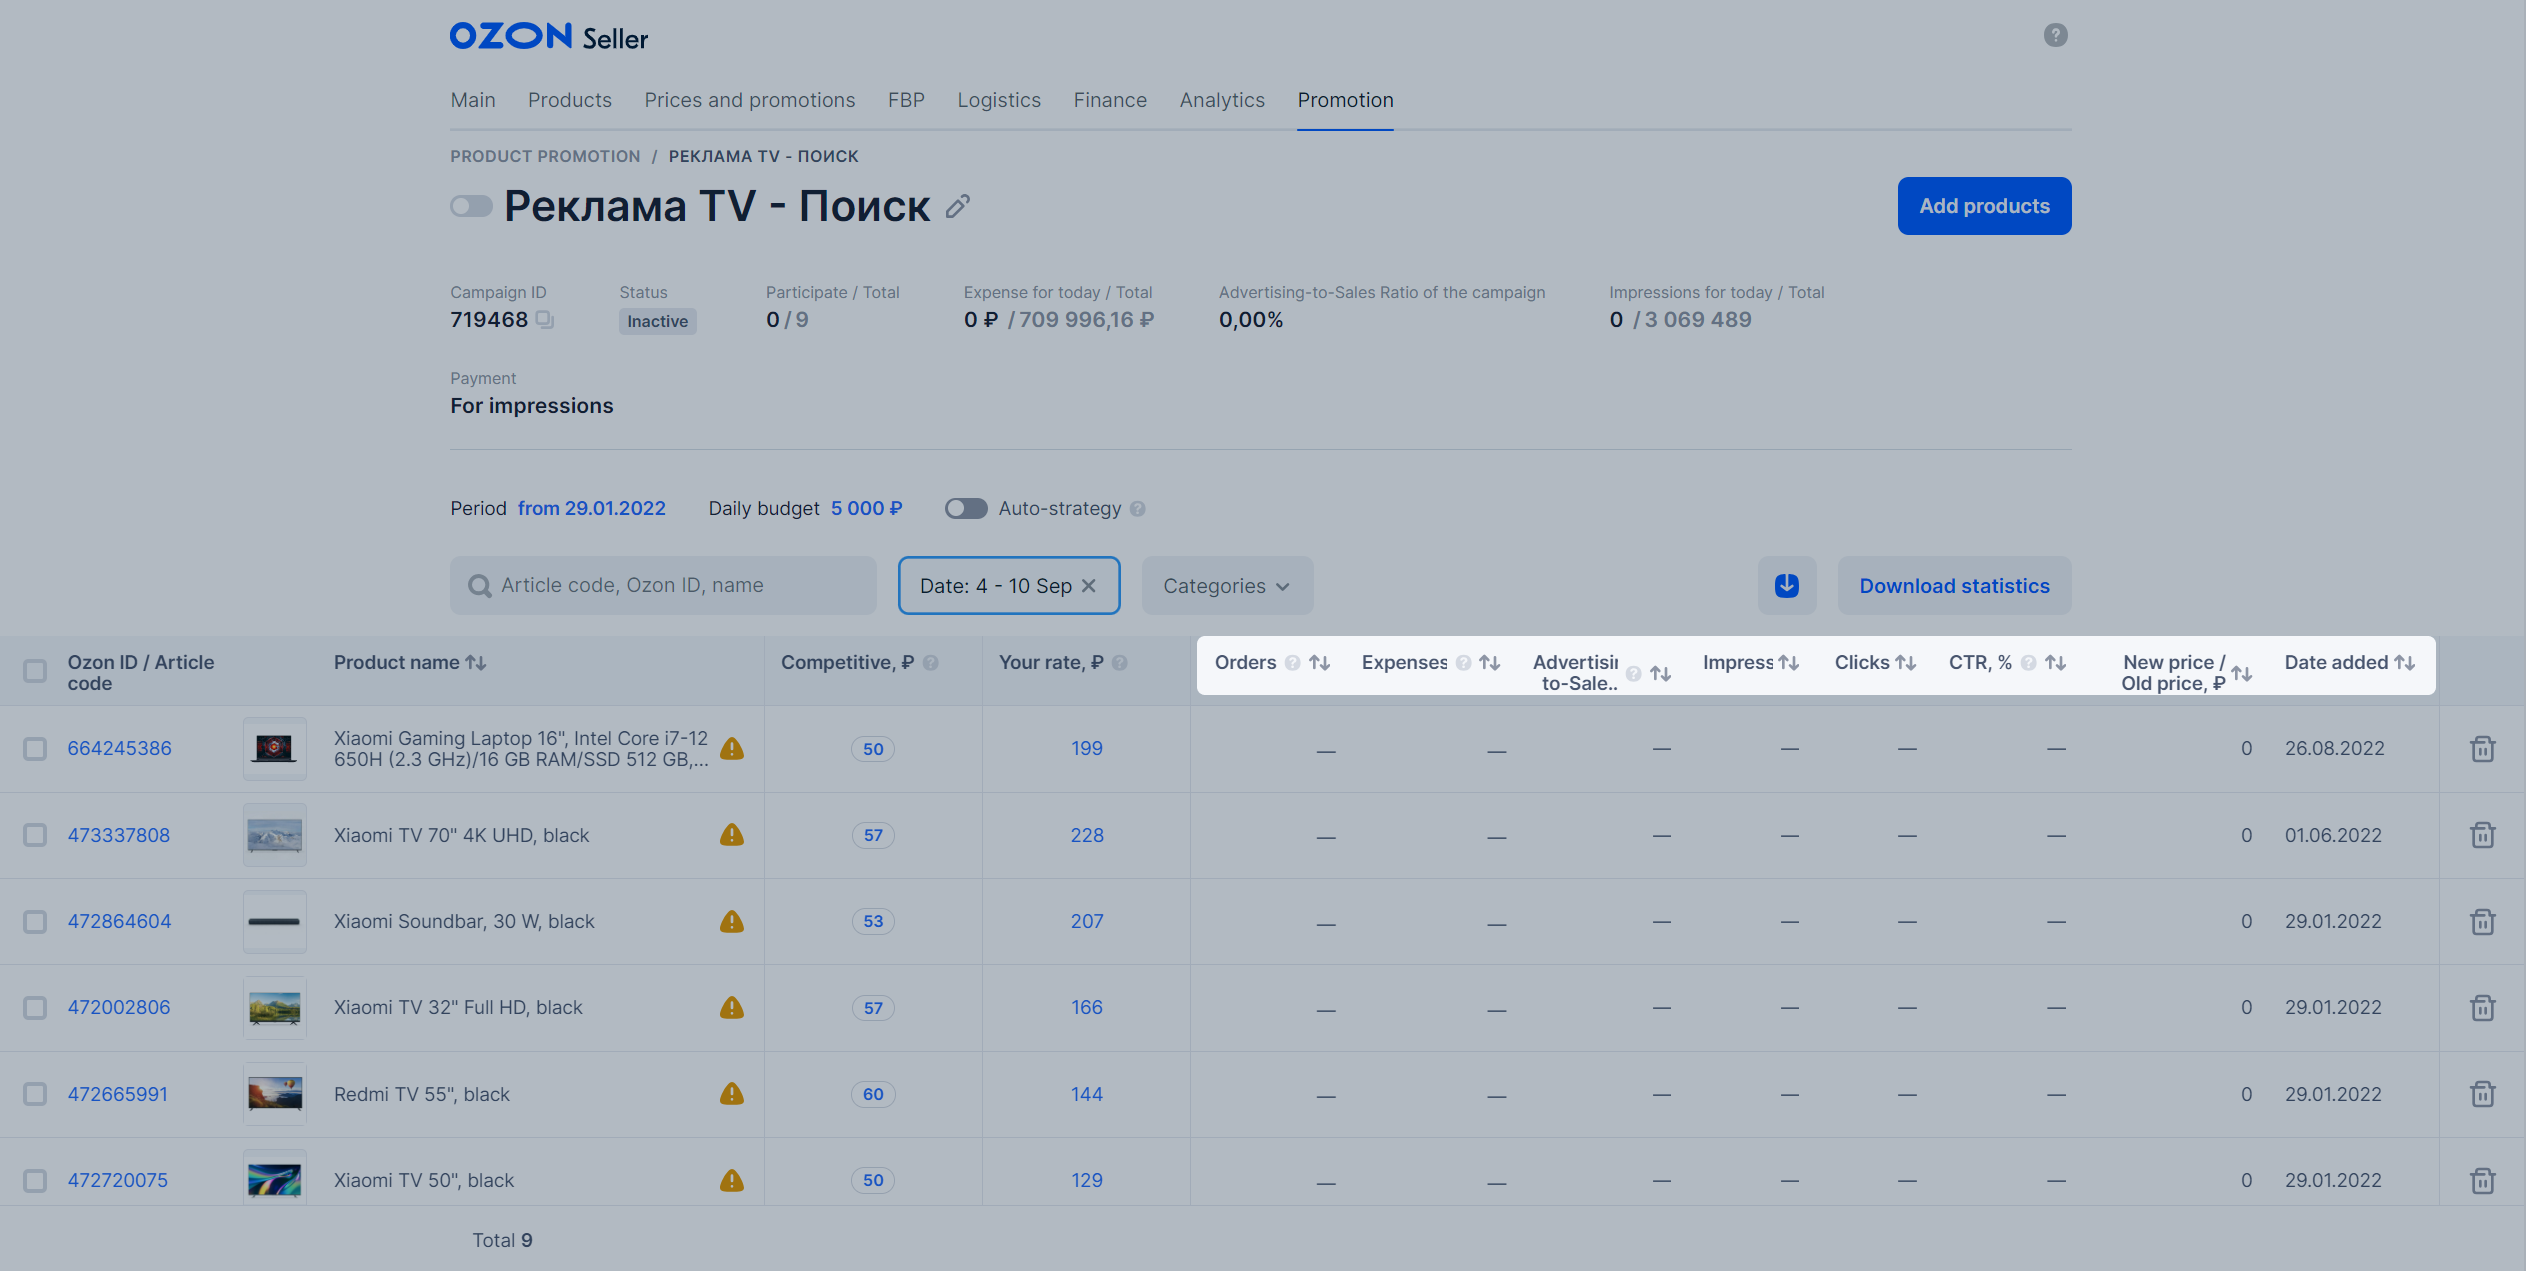
Campaigns that get fewer impressions than they could are marked with the yellow triangle next to their budget.
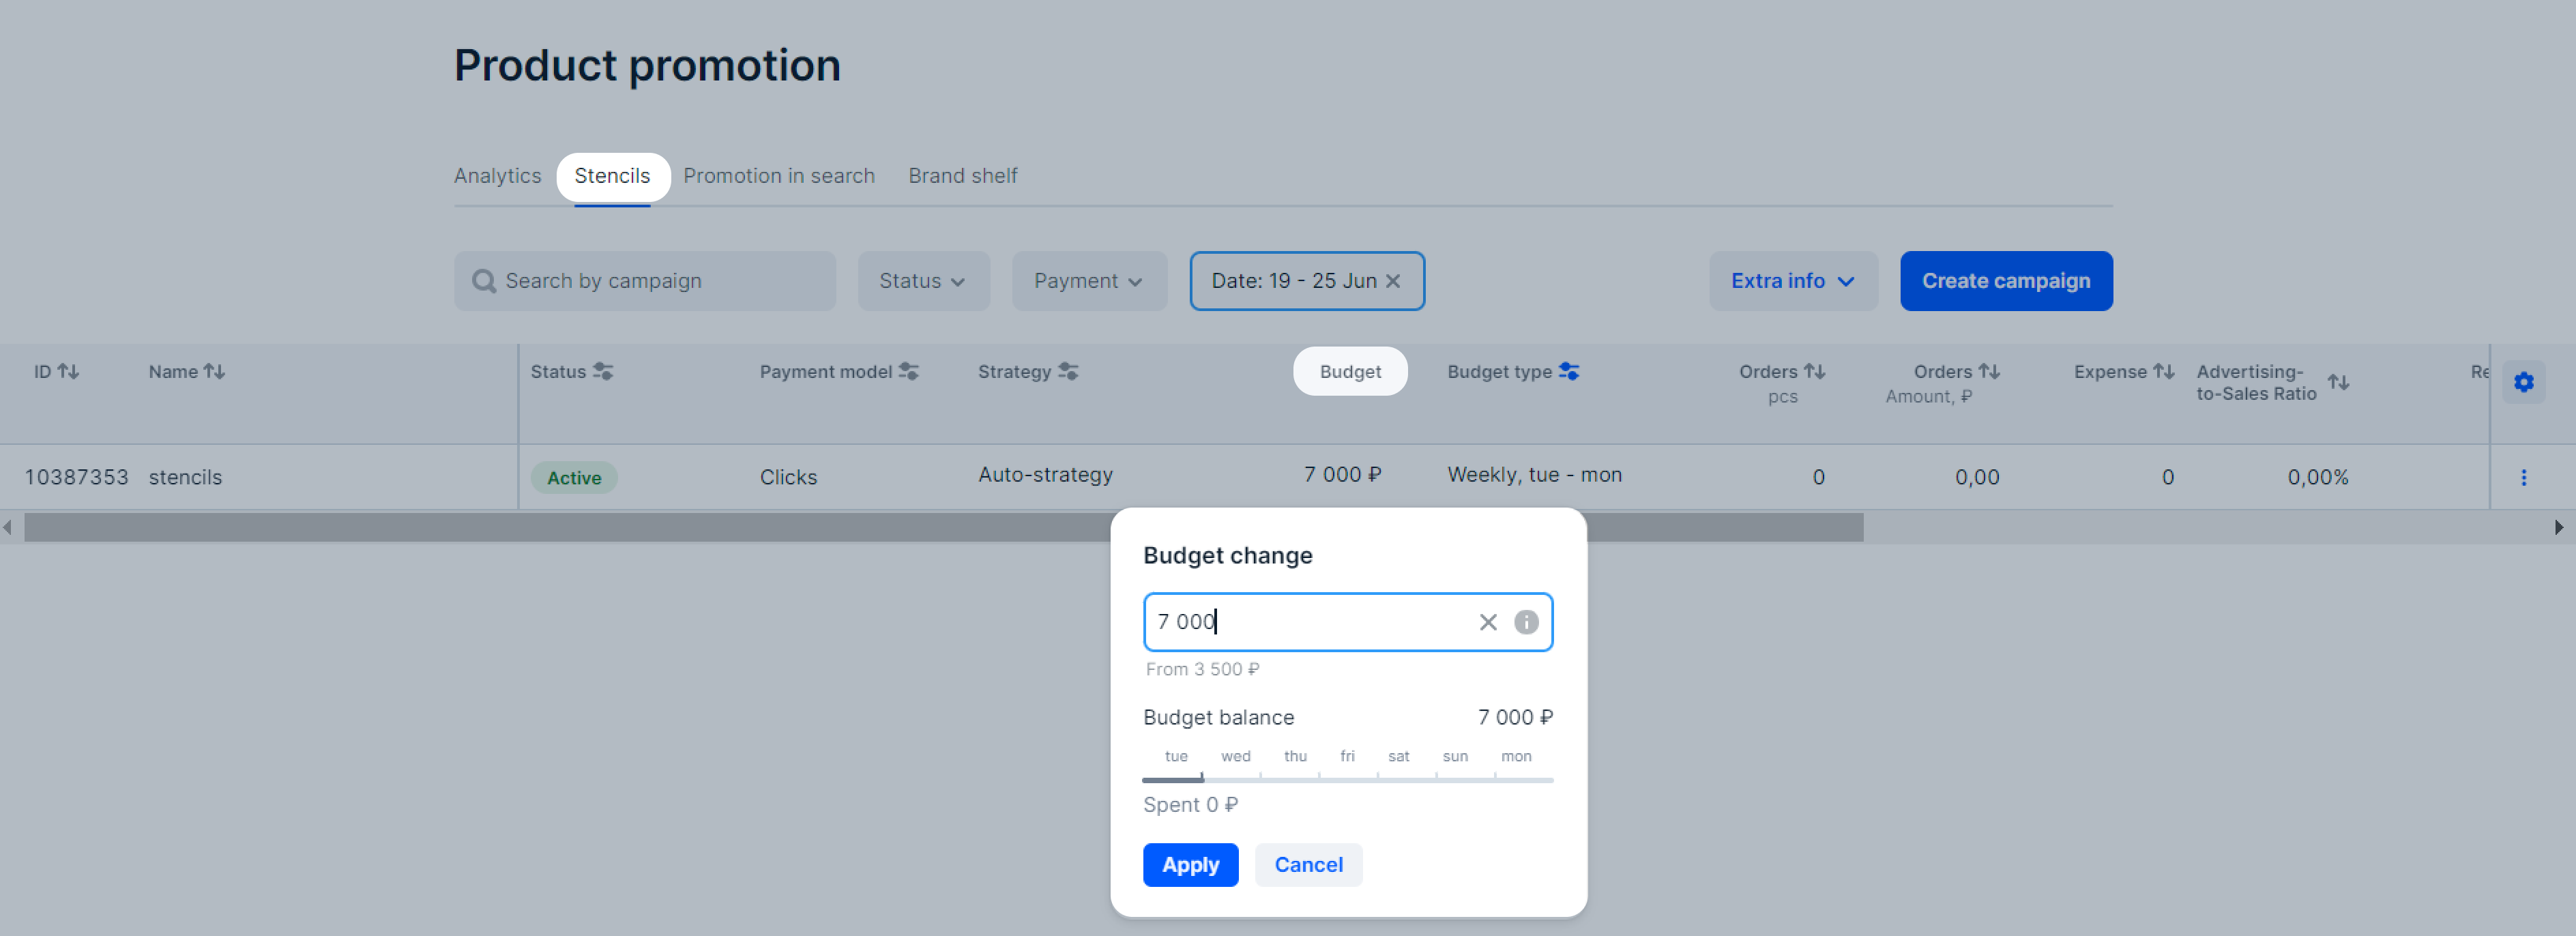
Change weekly budget #
You can decrease or increase the weekly budget at any time. To do this:
- Go to the Promotion → Stencils section.
- In the campaign row, click the amount in the Budget column.
- Enter a new value and click Edit. The weekly budget is recalculated based on the amount spent.
Example
Your weekly budget is 10,000 rubles. You launch a campaign with an auto-strategy enabled on Wednesday and by Saturday you spend 4,000 rubles on promotion. The remaining budget until next Tuesday is 6,000 rubles. You can:
- increase the budget balance up to 8,000 rubles: to do this, you need to increase the budget to 12,000 rubles;
- decrease the budget to 5,000 rubles, so from Saturday to Tuesday we’ll spend the remaining 1,000 rubles on promotion and stop the campaign until Wednesday;
- decrease the budget to 3,500 rubles, so after changing the budget, we’ll pause the campaign until next Wednesday.
Calculate weekly budget #
When calculating the weekly budget, take into account:
- the number of products in your campaign;
- the average product rate you’ve set;
- CTR: the average ratio of the number of clicks to the number of impressions;
- CR: the conversion to order;
- the number of orders you expect to get for each product per day.
Data for calculation:
- 4 products in the campaign;
- the average product rate is 10 rubles per click;
- CR is 5%;
- you expect to get at least 2 orders of each product per 24 hours.
With 5% CR, you need to get 20 clicks per one order.
To get 2 orders for each of 4 products, use the formula: average product rate × expected number of orders × number of products in the campaign.
Weekly budget equals to 20 × 10 × 2 × 4 × 7 = 11,200 rubles.
Auto-strategy #
If you don’t want to monitor the rates, enable the auto-strategy. The system changes rates automatically, taking into account competition in the category, so that the product is shown as often as possible within the weekly budget. The auto-strategy is suitable for new sellers and those who don’t want to monitor the competition and number of orders.
According to Ozon data for 2023, the share of promotional expenses in campaigns with enabled auto-strategy is 22% lower than in campaigns with manual rate management.
Minimum budget
Minimum weekly budget is 3,500 rubles.
You can track the campaign effectiveness 3–4 days after enabling the auto-strategy. It takes time for the algorithm to find the suitable rate for your product, depending on its placement. Therefore, in the first few days, the budget may not be fully used.
Edit or disable campaign #
In the Promotion → Stencils section, open the campaign.
You can:
- Rename the campaign: click
 next to the name.
 - Disable the campaign: click
 .
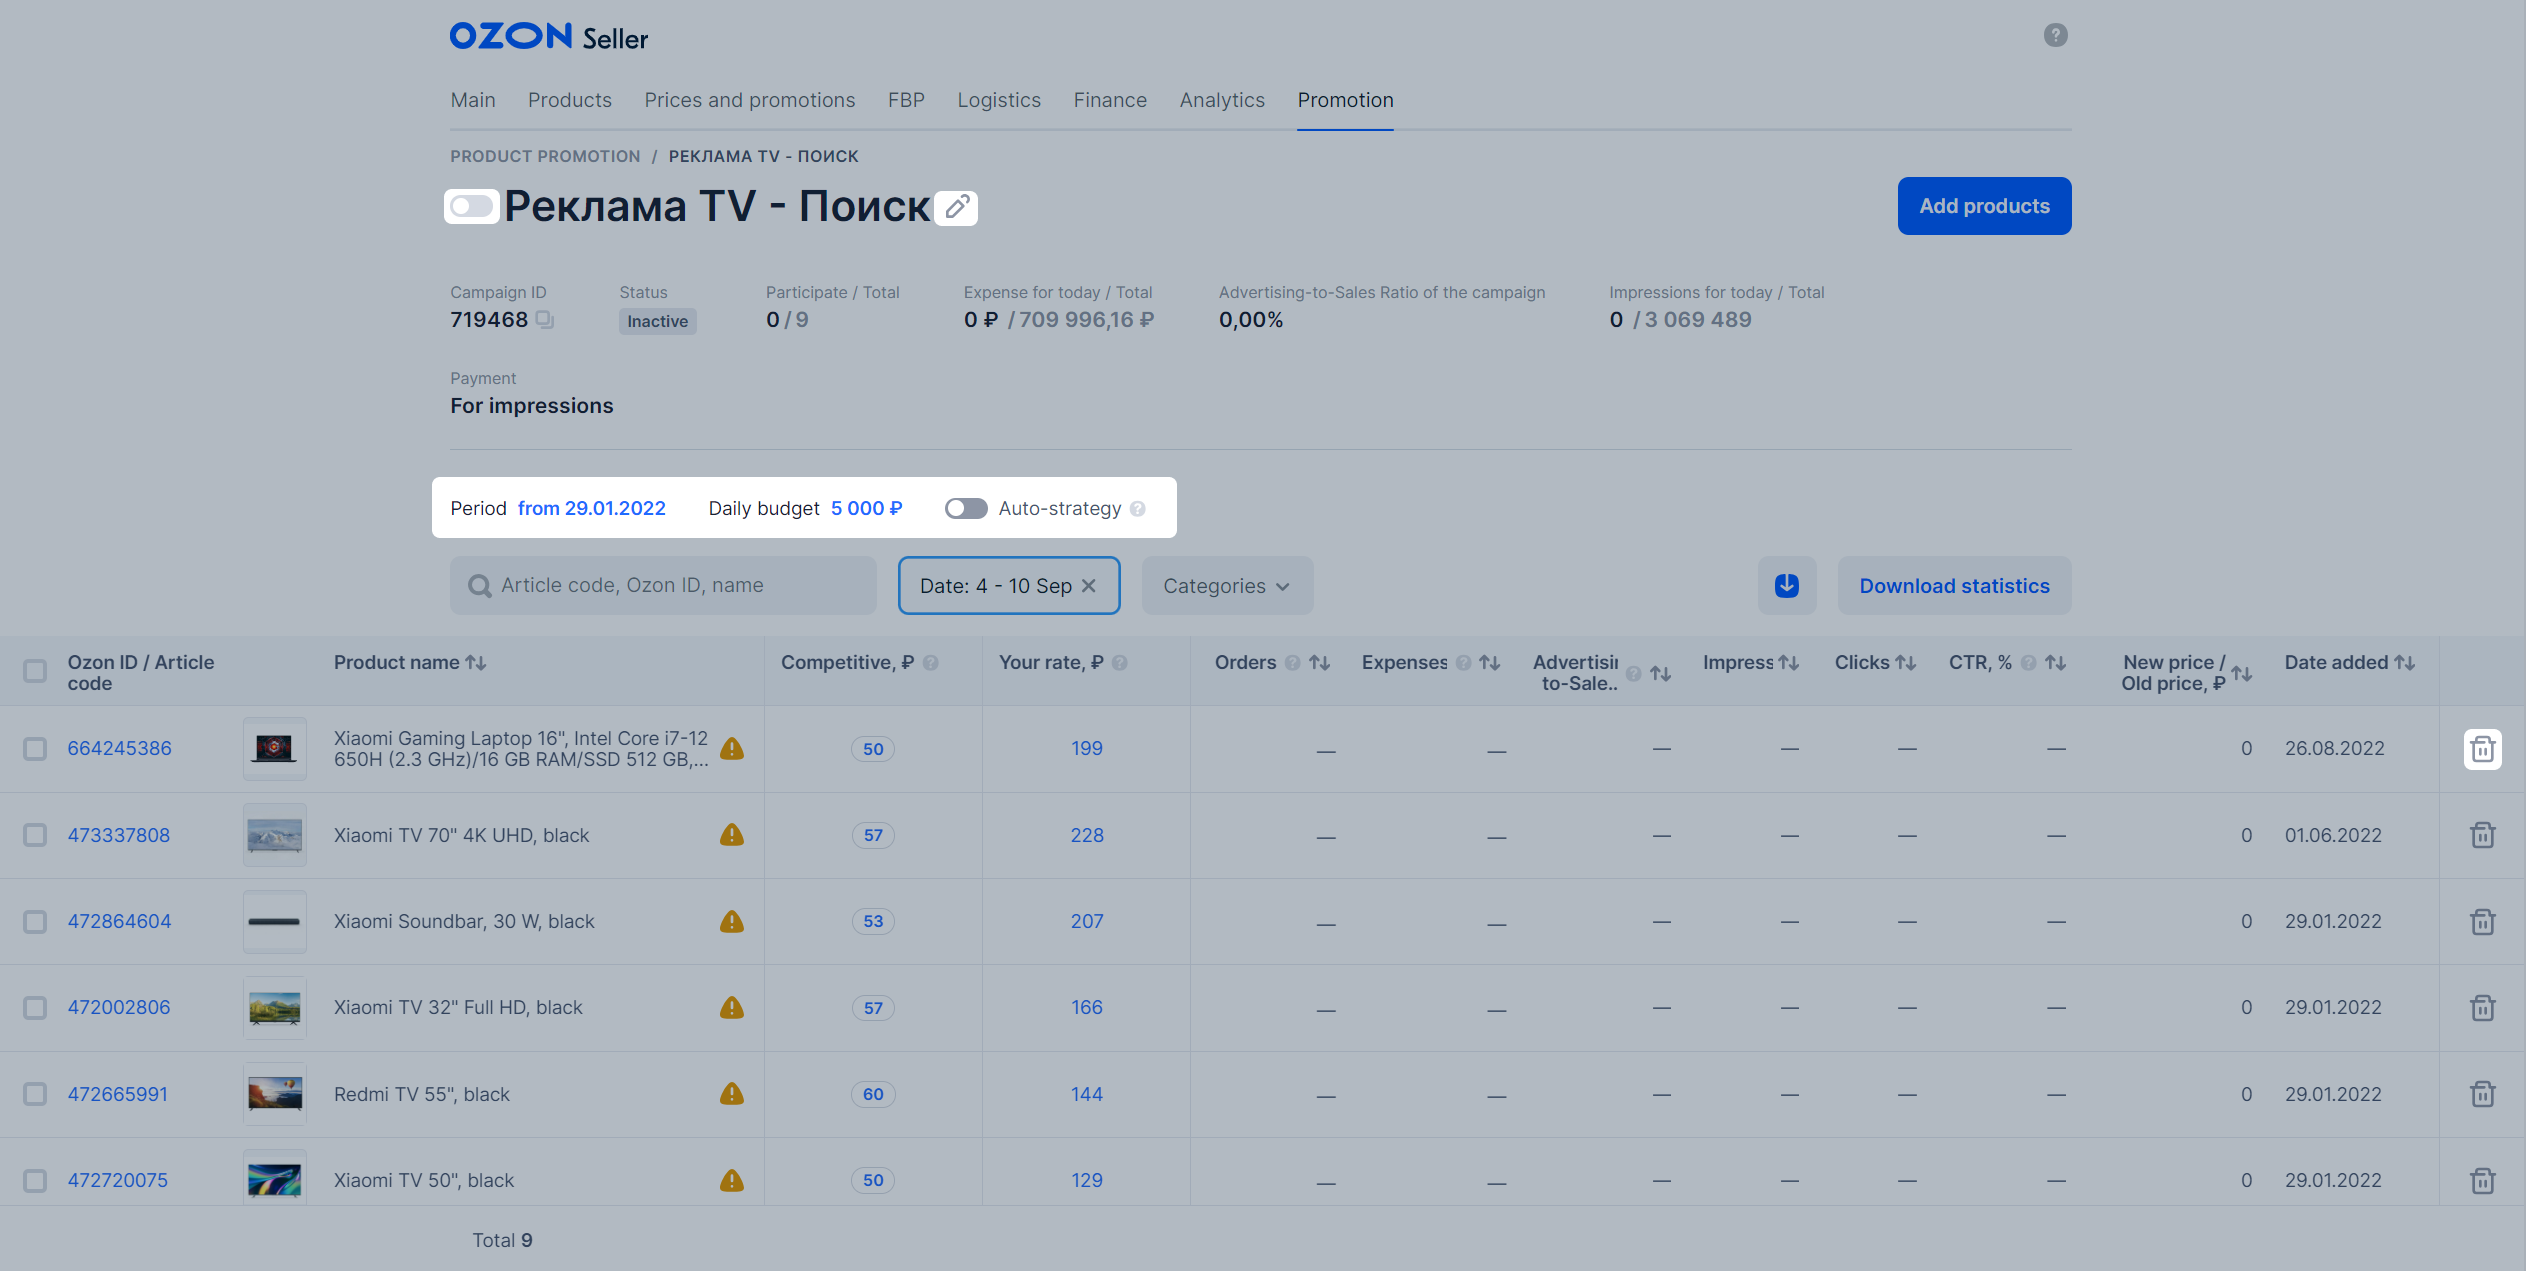
. - Change the campaign start day: click the date in the Period field.
- Change the weekly budget: click the amount and specify a different value. The data will be updated within 10 minutes.
- Change the rate management method: enable or disable the auto-strategy.
- Remove the product from the campaign: click
 next to the product.
 - Remove several products: select them and click Delete at the bottom of the screen.
- Set a general rate for products if the auto-strategy is disabled: select them and click Set rate at the bottom of the screen.
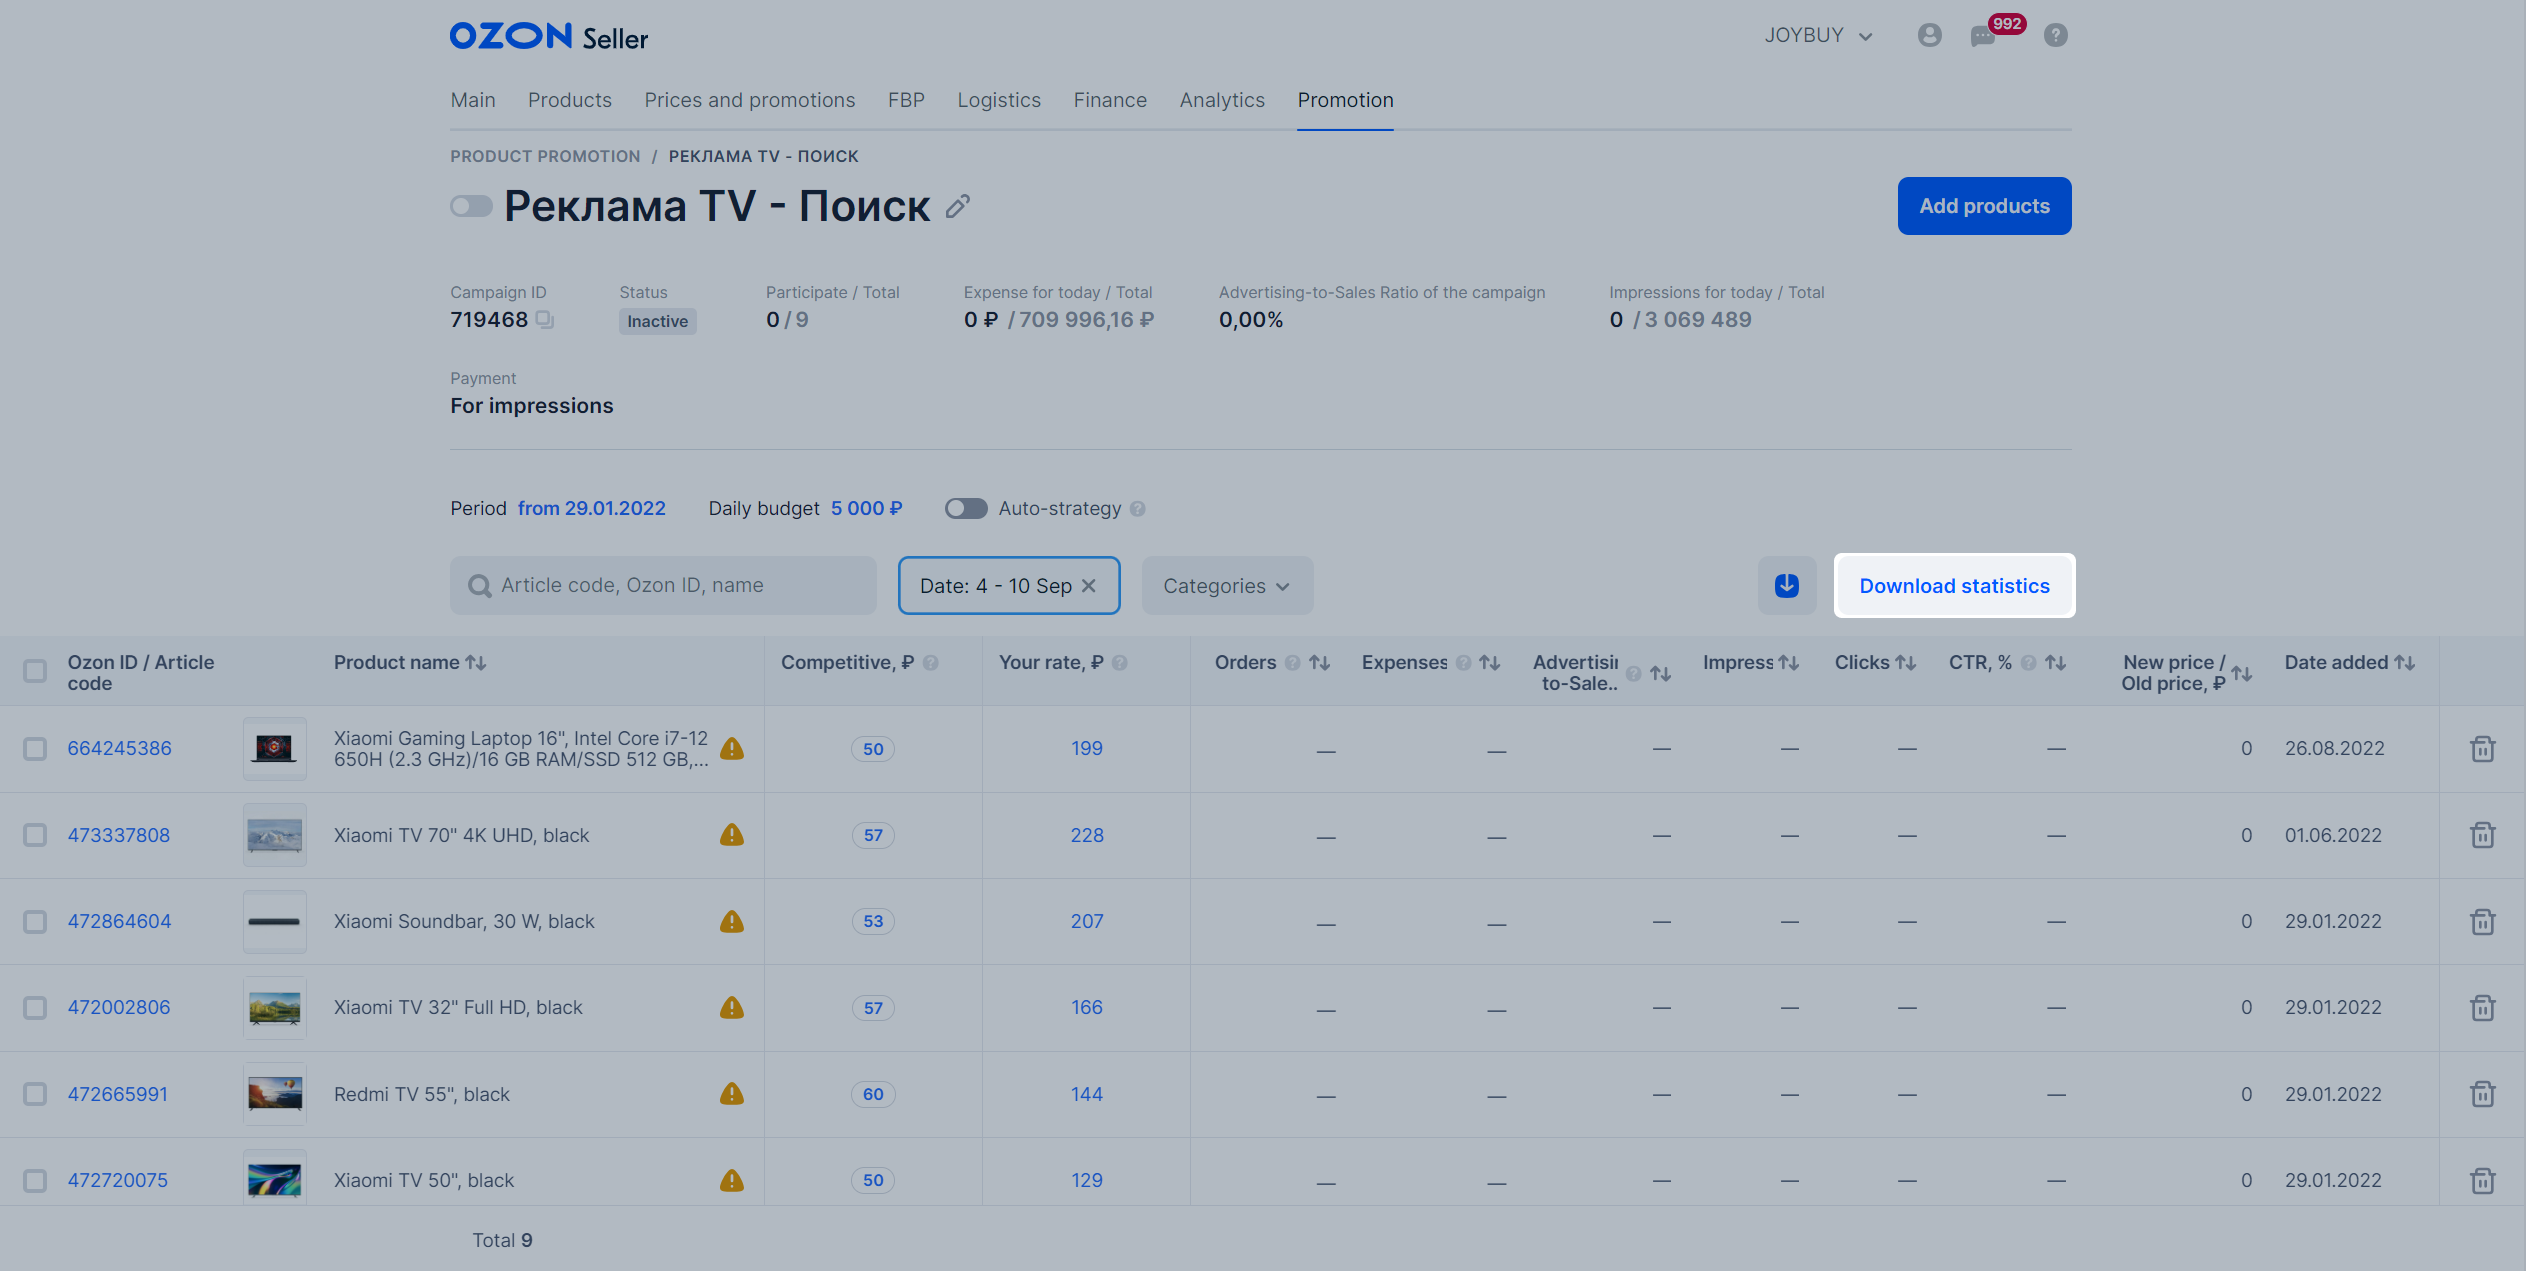
View statistics #
You can view the promotion statistics on the campaign page, in the report, or on the Promotion analytics tab.
Learn more about the “Promotion analytics” tab
Improve metrics #
-
Use video covers. Instead of the main photo, you can add a short video to the PDP. If the product has won the auction, we’ll show the video on the search results and categories pages:
- the video plays automatically if the card is at least 30% visible;
- the video plays without sound for the first 8 seconds, then the main photo is displayed.
Once uploaded, the video cover goes through moderation. It may take some time. Therefore, we recommend activating the campaign after the video cover appears in the PDP.
Learn more about uploading video covers -
Use other promotion tools as well.
Pay for campaign #
You don’t have to replenish the budget for promotion campaigns in advance. We withdraw campaign expenses once a month. You can pay for Stencils with bonuses. You can view all expenses:
- in your personal account in promotion reports;
- in the Finance → Accruals → Additional services section;
- in the completion report that is formed within the first five business days of the month, but no later than the 8th calendar day of the month.