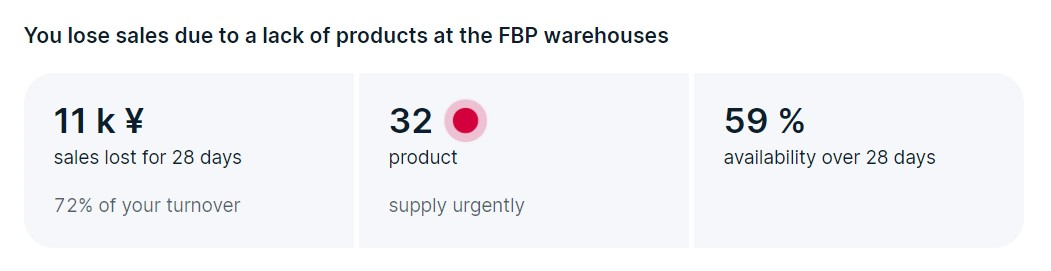
In the FBP -> Product availability section, we show:
- sales amount you lost due to out-of-stock products for the last 28 days;
- products and their amount you should supply in order not to lose sales;
- realFBS products you can supply to the FBP warehouse to increase sales.
Keep track of the key metrics:
- Lost sales: the amount of sales you lost due to out-of-stock product.
- Product availability: products in stock at FBP and realFBS warehouses. This metric is higher if your products are regularly in stock. The higher it is, the less sales you lose.
- Until the end of the stock: how many days' worth of stock you have left at your sales pace. Available for each product.
Planning supplies in order not to lose sales #
- Check the metric widget on the main page. If it shows lost sales and products to be supplied, view details in the Product availability section.
- In the table, view the products that will be out of stock soon. We show a recommendation for each product:
- Supply urgently: the product will be out of stock at the FBP warehouse in less than 10 days. Supply it in the first place.
- Supply soon: the product will be out of stock at the FBP warehouse in less than 30 days. You don’t have to supply this product at first, but you can supply it along with products with the Supply urgently recommendation to replenish stocks for all in-demand products at once.
- Enough for now: product stocks at the FBP warehouse are enough and you can supply it as usual.
- Supply to FBP: the product average daily sales are more than one item under the realFBS scheme. Consider its supply to the FBP warehouse to increase sales.
- Maintain the stock: the product average daily sales are less than one item under the realFBS scheme. Supply the product as usual and restock it on time.
You can add products recommended for supply when creating a supply request.
- Check the products that are on the way. To calculate their number correctly, delete outdated supply requests in the Ready for shipment status.
- Click Make supply to create an editable draft of the supply request. It will contain the recommended number of all products with Supply urgently, Supply soon, and Supply to FBP tags.
Customizing the report #
You can set up filters. Select:
- FBP and FBP/rFBS to view only those products that are sold under the FBP scheme;
- Category and Article code to find a specific product or category;
- Supply urgently, Supply soon, and Supply to FBP to view only products with a specific recommendation.
To download a file with all products recommended for supply, click Download.
Example of calculating the total availability metric #
We update metrics every morning based on the data over the last 28 days, and we take into account the stocks and products on the way for which delivery is planned at the end of the previous day.
Sales scheme
Product availability, %
Total availability
Calculation example:
-
We check the number of days each product has been in stock under at least one scheme for the last 28 days, and calculate the product availability.
For example, you have 3 products:
- The first product was in stock for 14 days out of 28, so it was available to purchase 14 ÷ 28 × 100% = 50% of the time. The availability of this product equals 50%.
- The second product was in stock for 10 days out of 28, so it was available to purchase 10 ÷ 28 × 100% = 35% of the time. Its availability equals 35%.
- The third product was in stock for 7 days out of 28, so it was available to purchase 7 ÷ 28 × 100% = 25% of the time. Its availability equals 25%.
-
We check the average daily sales under the FBP and realFBS schemes in the sales currency: the total amount and sales of each product separately. After that we calculate the total amount of sales for 28 days and divide by the number of days when the product was in stock.
For example:
- For the first product, customers paid a total of 14,000 CNY, and it was available for sale for 14 days out of 28. The amount of average daily sales is: 14,000 ÷ 14 = 1,000 CNY.
- For the second product, customers paid a total of 4,000 CNY, it was available for sale for 10 days out of 28. The amount of average daily sales is: 4,000 ÷ 10 = 400 CNY.
- For the third product, customers paid a total of 700 CNY, it was available for sale for 7 days out of 28. The amount of average daily sales is: 700 ÷ 7 = 100 CNY.
Total average daily sales for all products equals 1,500 CNY.
-
We calculate the share of average daily sales of each product. According to the metric, we estimate which of them could bring you the most sales if it had been in stock for all 28 days. This product has the most impact on the overall metric.
For example, if your product is inexpensive and is selling poorly, it won’t have as much of an impact on lost sales. But if a product is bought frequently and its price is higher, the lack of such a product in stock strongly affects the total availability metric and lost sales.
Then we divide the amount of average daily sales for each product by the total amount of all sales and get:
- the share for the first product of 0.67;
- the share for the second product of 0.27;
- the share for the third product of 0.6.
-
We summarize the data for each product into a total. To do this, we multiply the availability of each product by its share and sum up:
Total availability = (Product availability 1 × Product share 1) + (Product availability 2 × Product share 2) + (Product availability 3 × Product share 3).
Total availability:
(0.67 × 50) + (0.27 × 35) + (0.6 × 25) = 33.5 + 9.45 + 15 = 57%.
Average daily sales in the sales currency
We divide the sales amount for 28 days by the number of days when the product was in stock under at least one of the schemes: FBP or realFBS.
For example, customers ordered products for 28,000 CNY in 28 days. The product was in stock for 14 days. The average daily sales are 28,000 ÷ 14 = 2,000 CNY.
Lost sales
Lost sales is the amount of sales you lost due to out-of-stock products. Average daily sales are multiplied by the number of days the product was out of stock.
For products sold only under the realFBS scheme, we add 30% to the resulting amount, since the products sold under the FBP scheme are displayed higher in search results.
Recommendation
Number of days until the product stocks end:
- Supply urgently: the product will be out of stock in less than 10 days.
- Supply soon: there are stocks enough for 10–30 days.
- Enough for now: the product can be supplied as usual to maintain availability. There’s enough stock for more than 30 days.
- Supply to FBP: the product was sold under the realFBS scheme and it has no FBP stocks. At the same time, its average daily sales are more than one item under the realFBS scheme. We recommend to supply the product under the FBP scheme.
- Maintain the stock: the product average daily sales are less than one item under the realFBS scheme. Supply products under a convenient scheme, replenishing the stocks in a timely manner.
Recommended supply
A sufficient number of product items for sale within 30 days. We multiply the average daily sales by 30 and subtract the stocks and products on their way to the FBP warehouse.
To calculate recommendations for products sold under the realFBS scheme only, we don’t take into account the stocks.