With the “What affects your search ranking” tool, you can analyze the products in search and see why the product is in a particular position.
The tool allows you to:
- view how a customer from the selected region sees the search results: search results display order, product photos and descriptions;
- find out what affects the position in search results;
- view metrics for products with a high position;
- compare your products with other sellers' products;
- evaluate the parameters and the region with which the products are ranked high;
- figure out how to improve the PDP so that more customers can see it.
View product analytics in search results #
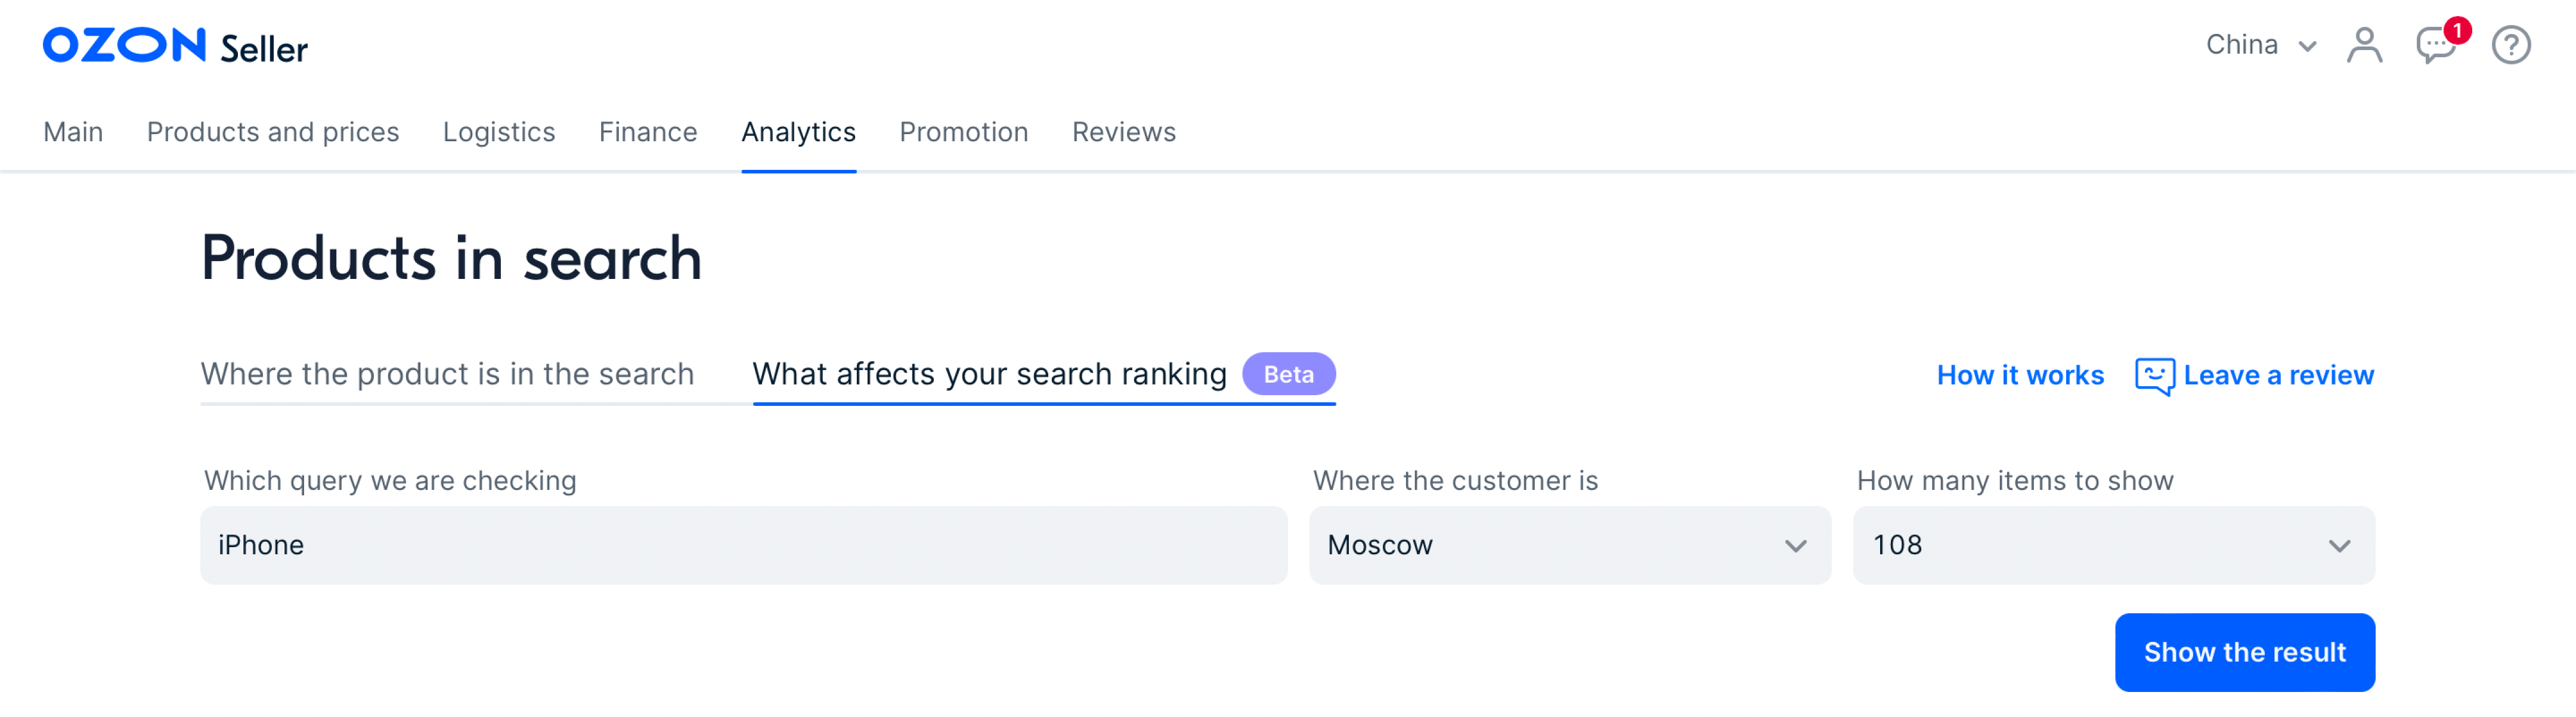
- Select Analytics → Product in search results → What affects your search ranking.
- Enter the query you want to check.
- Select the customer’s city or region. We take into account location that the customer specified in the settings or that the system detected automatically.
- Select the number of search result positions to show.
- Check the search parameters and click Show the result.
 You’ll see a brief search results analytics and a table with products by request.
Brief search results analytics #
In brief analytics, your products are compared with competitors' products by parameters that are easiest to affect.
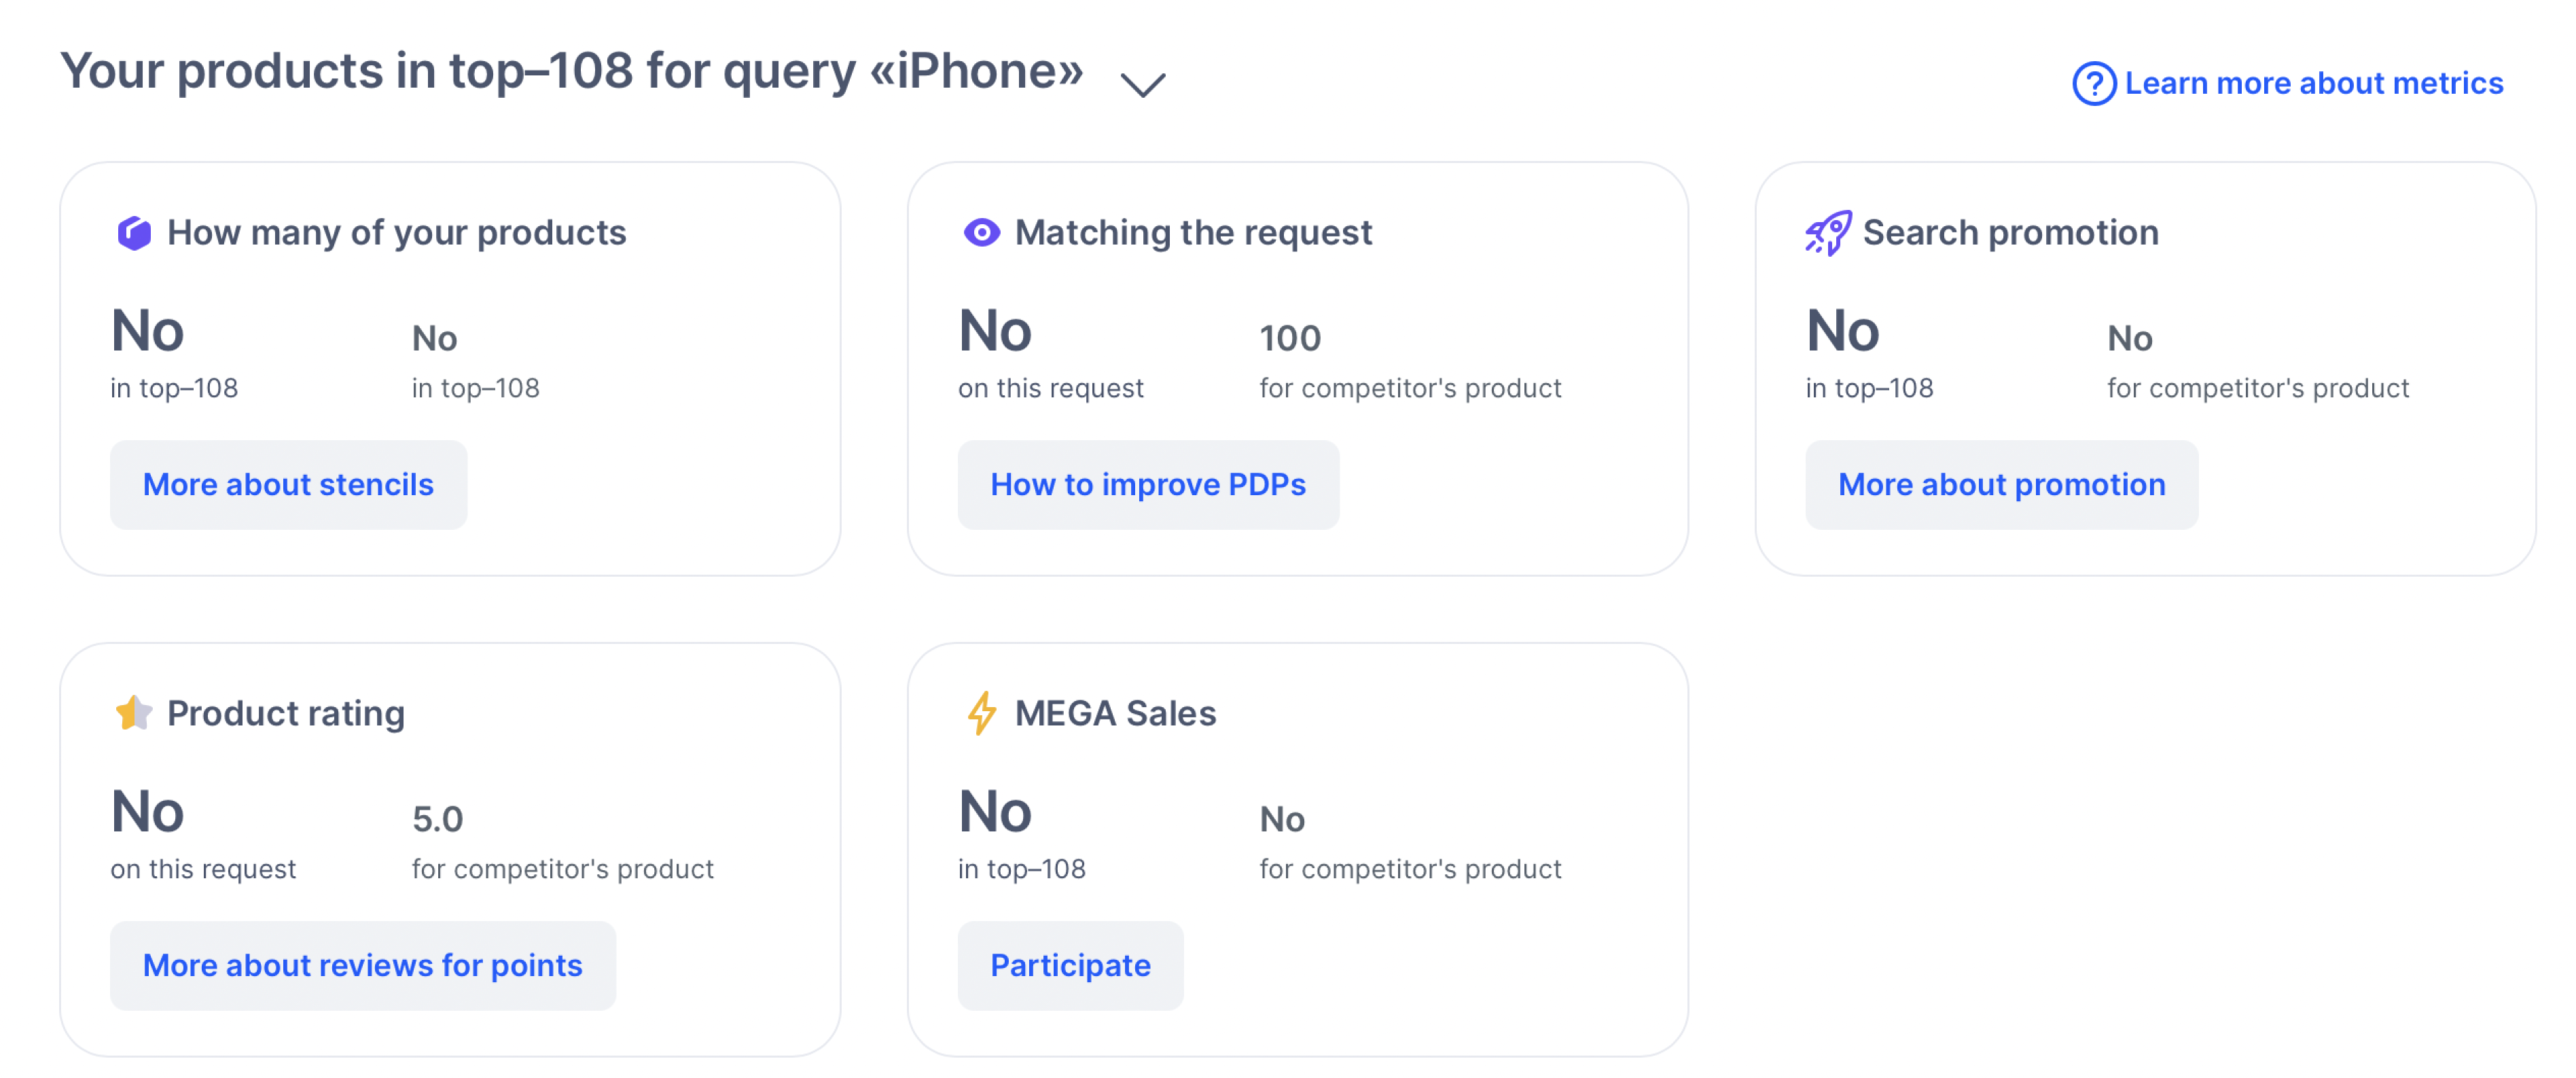
We compare only your products for the “How many of your products” parameter. For others, your products are compared with other sellers' products..
| Parameter | Description |
|---|---|
| How many of your products | Number of your products: • in the selection you specified in the How many positions to show field, for example, in the top 10 or 72; • in the entire search results for this query. |
| Matching the request | How well the name, description, and other fields fit the query. The more precisely the product matches the search phrase, the more points it gets. We show: - your product with the lowest score; - another seller’s product with the highest score. Click How to improve PDPs to check and correct your product description. Focus on content rating and general recommendations. |
| Search promotion | How many products participate in paid promotion. The service additionally raises the product in search results and helps to improve the characteristics that can’t be affected directly. |
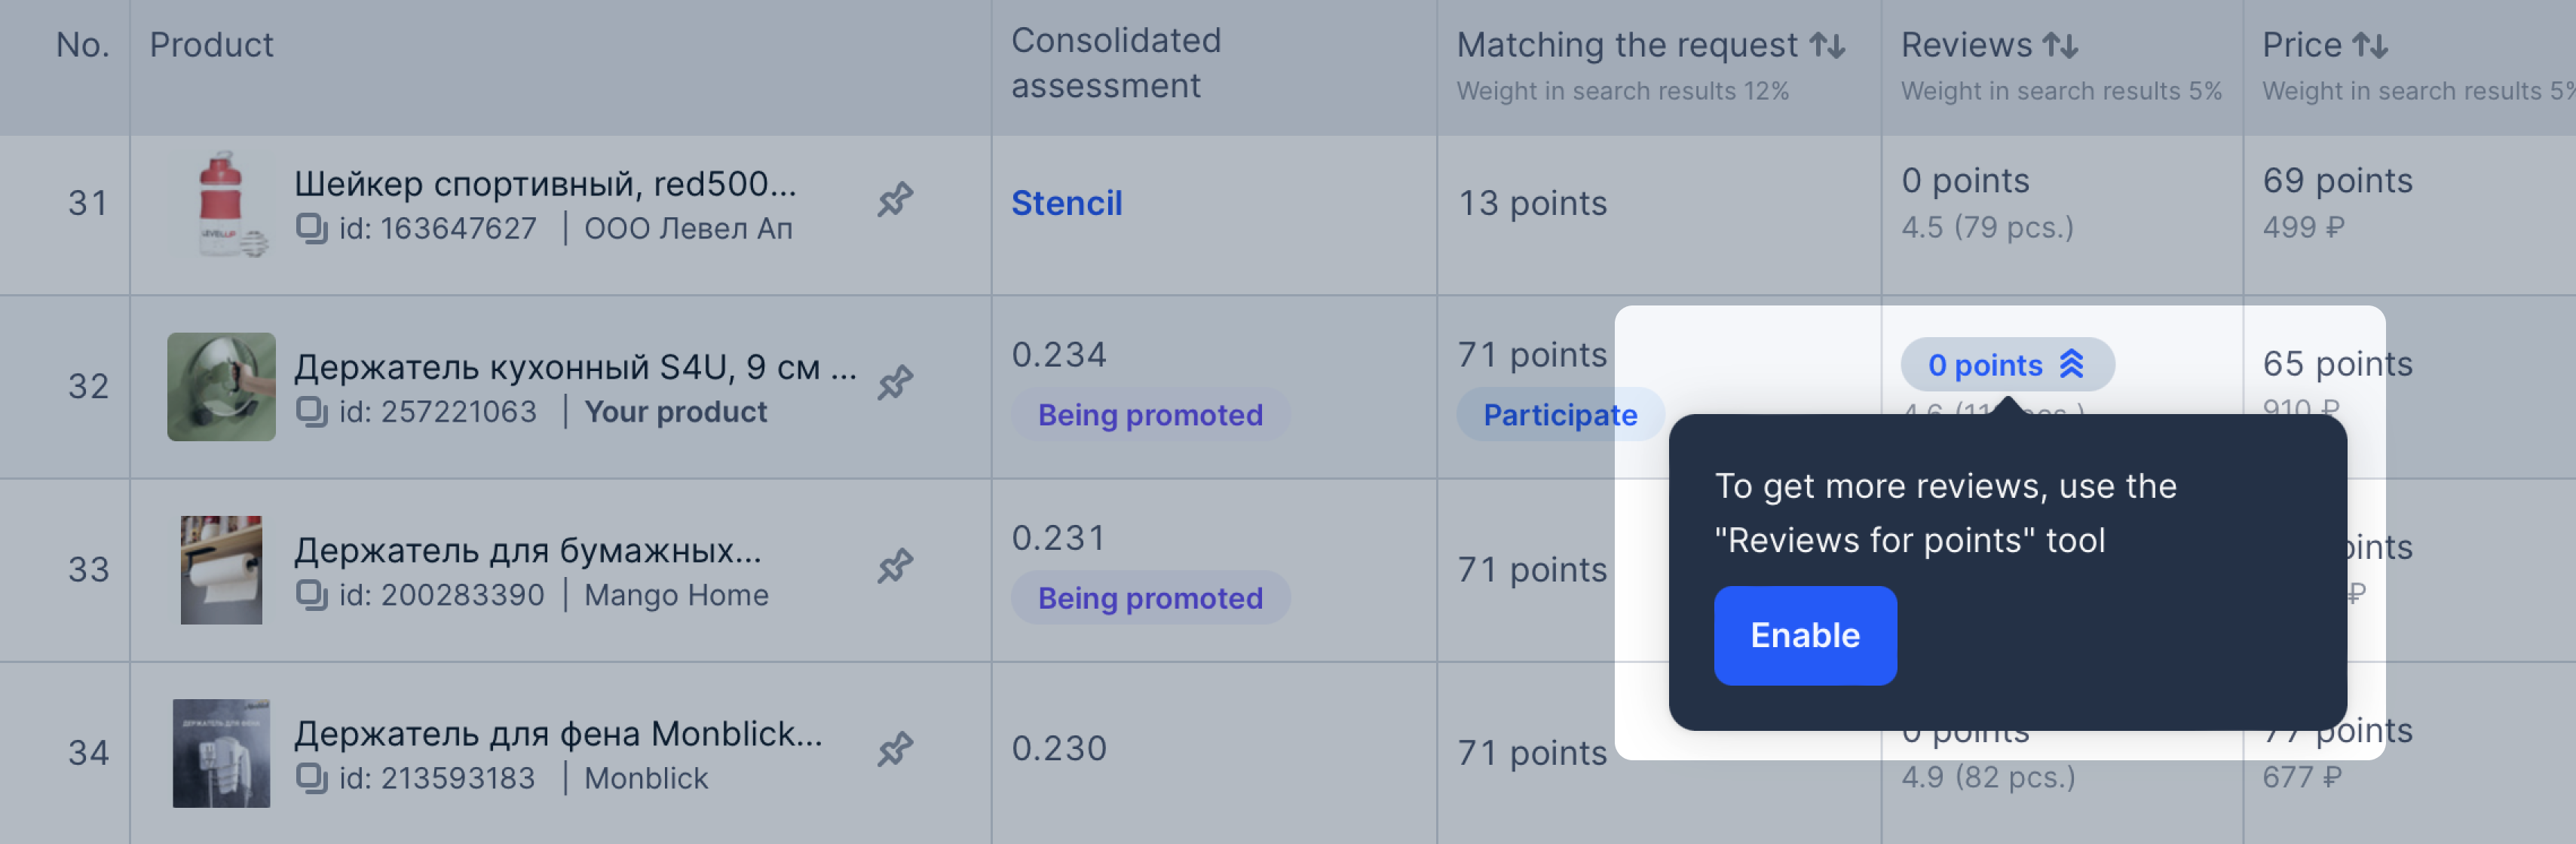
| Product rating | We show the rate of: • your product with the lowest rating; • another seller’s product with the highest rating. Rating affects the position in search results and the customers' trust. They often choose products with a high rating and detailed reviews with photos and videos. To improve the rate, invite customers to leave reviews for points. |
| Mega sales | How many products participate in Ozon promotions. For example, “Discount Marathon”, “11.11”, and “Black Friday”. To make promotional products get more attention from customers, we: • raise them in search results; • place them on the promotional pages; • add a badge with the promotional name or the discount amount to the PDP. |
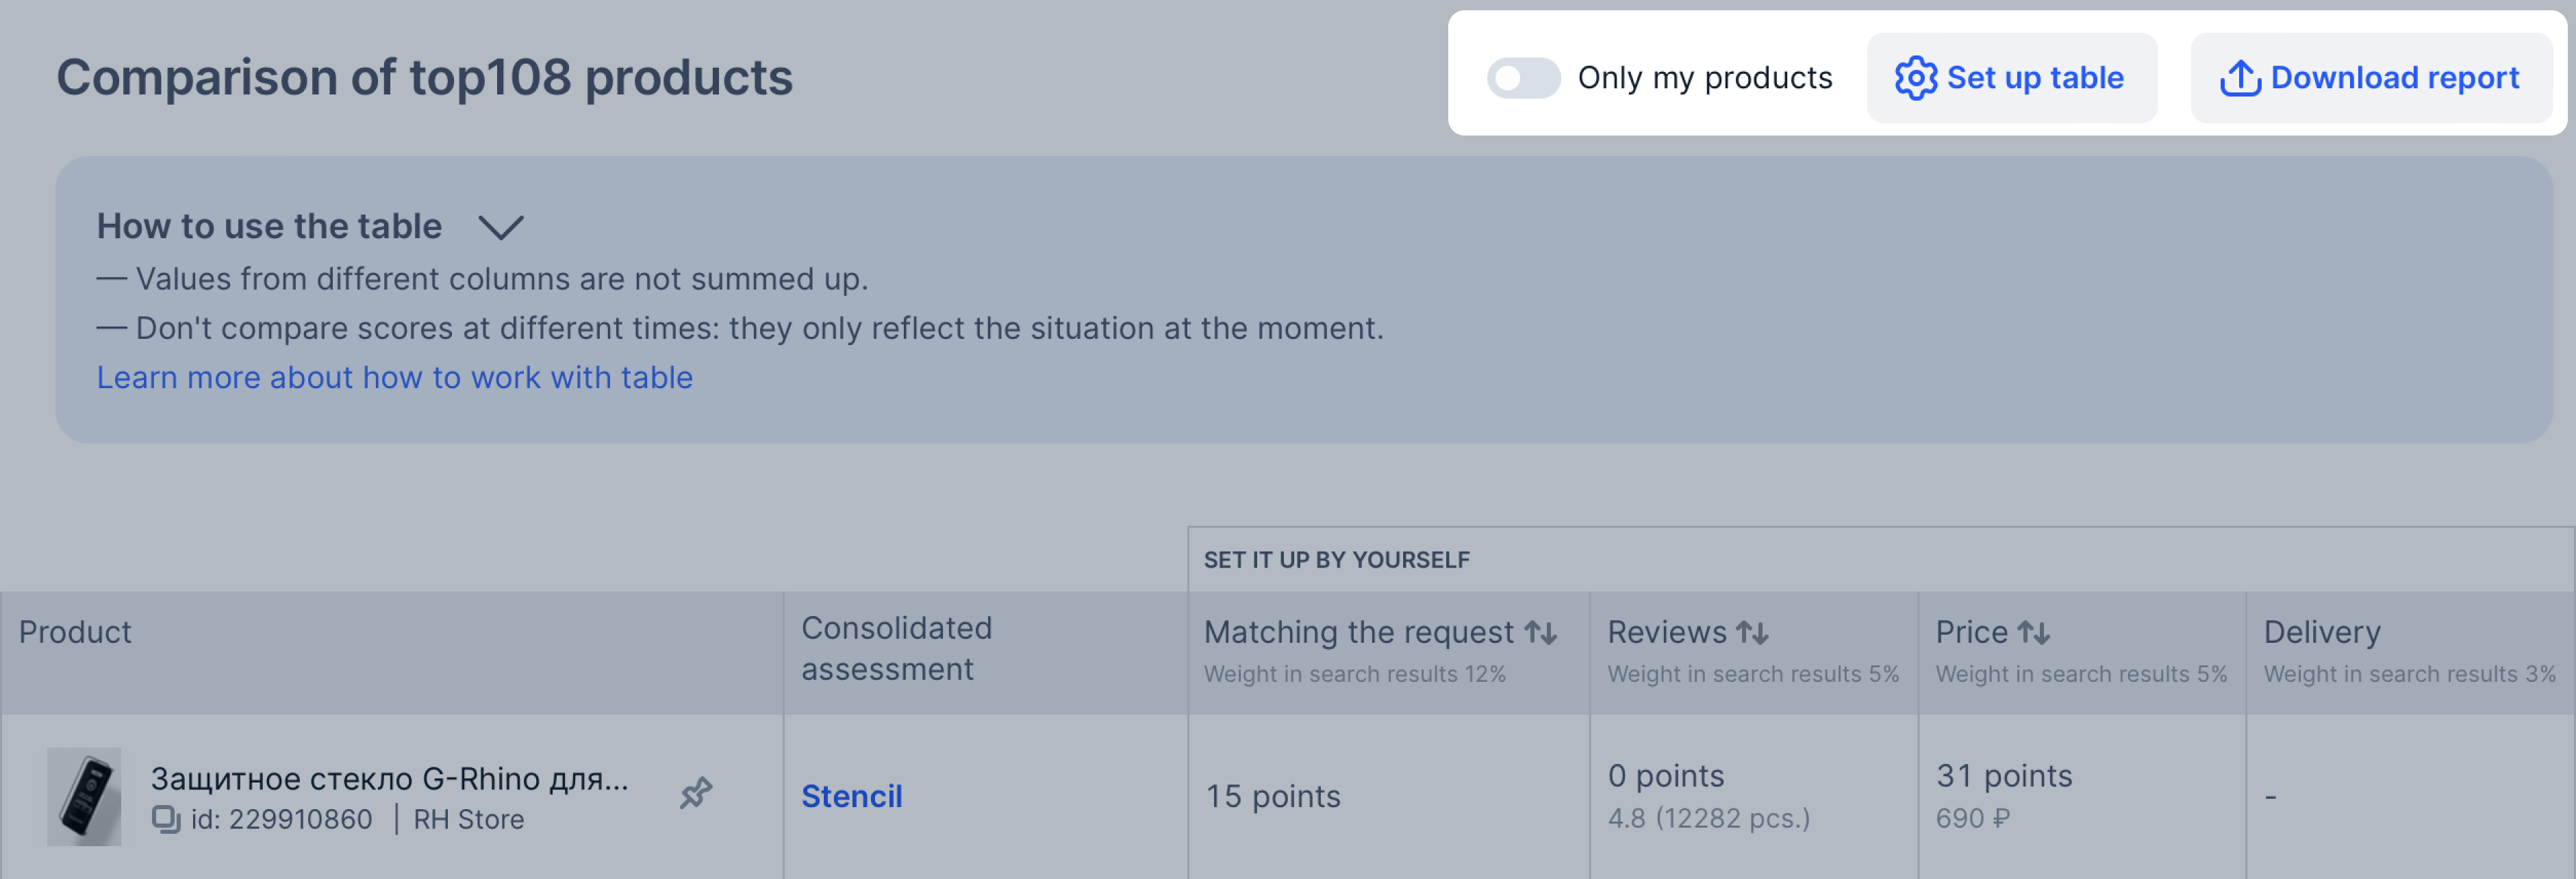
Table of products in search results #
For each product the table displays:
- place in search results;
- brief product description: photo, name, ID, store name;
- the resulting score for all metrics that affect the place in search results;
- metrics for comparison.
You can view product ratings in search results for each parameter. To see the tooltip for a parameter, hover your cursor over its name.
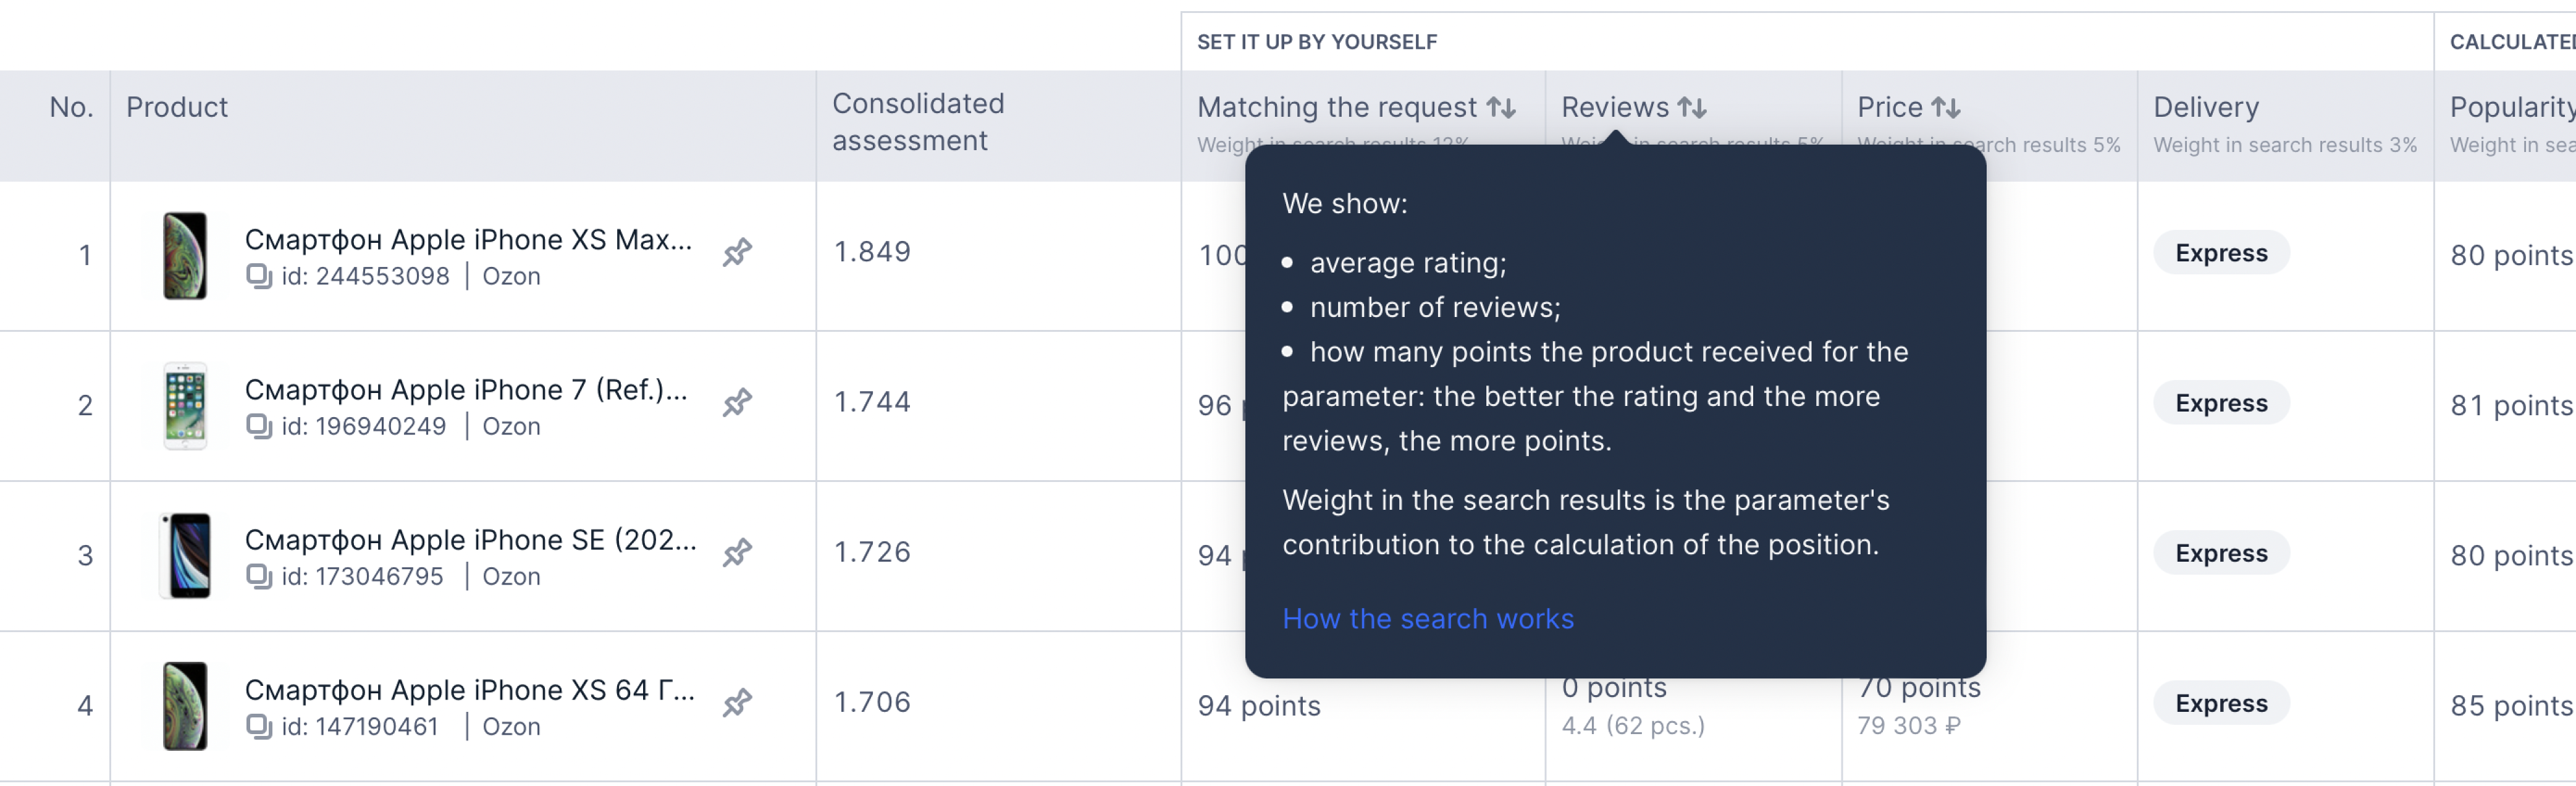
For convenience, the parameters are combined in meaning. For convenience, the parameters are combined in meaning. For example, “Reviews” include the rating and the number of reviews.
For each parameter the table displays:
- rate in points: whether the product meets the criteria;
- weight: whether the parameter affects the calculation of the position;.
You can configure which parameters to show in the table and download the report in Excel format.
Parameters in the table #
The parameters are divided into two groups:
-
Set it up by yourself: basic parameters you can affect.
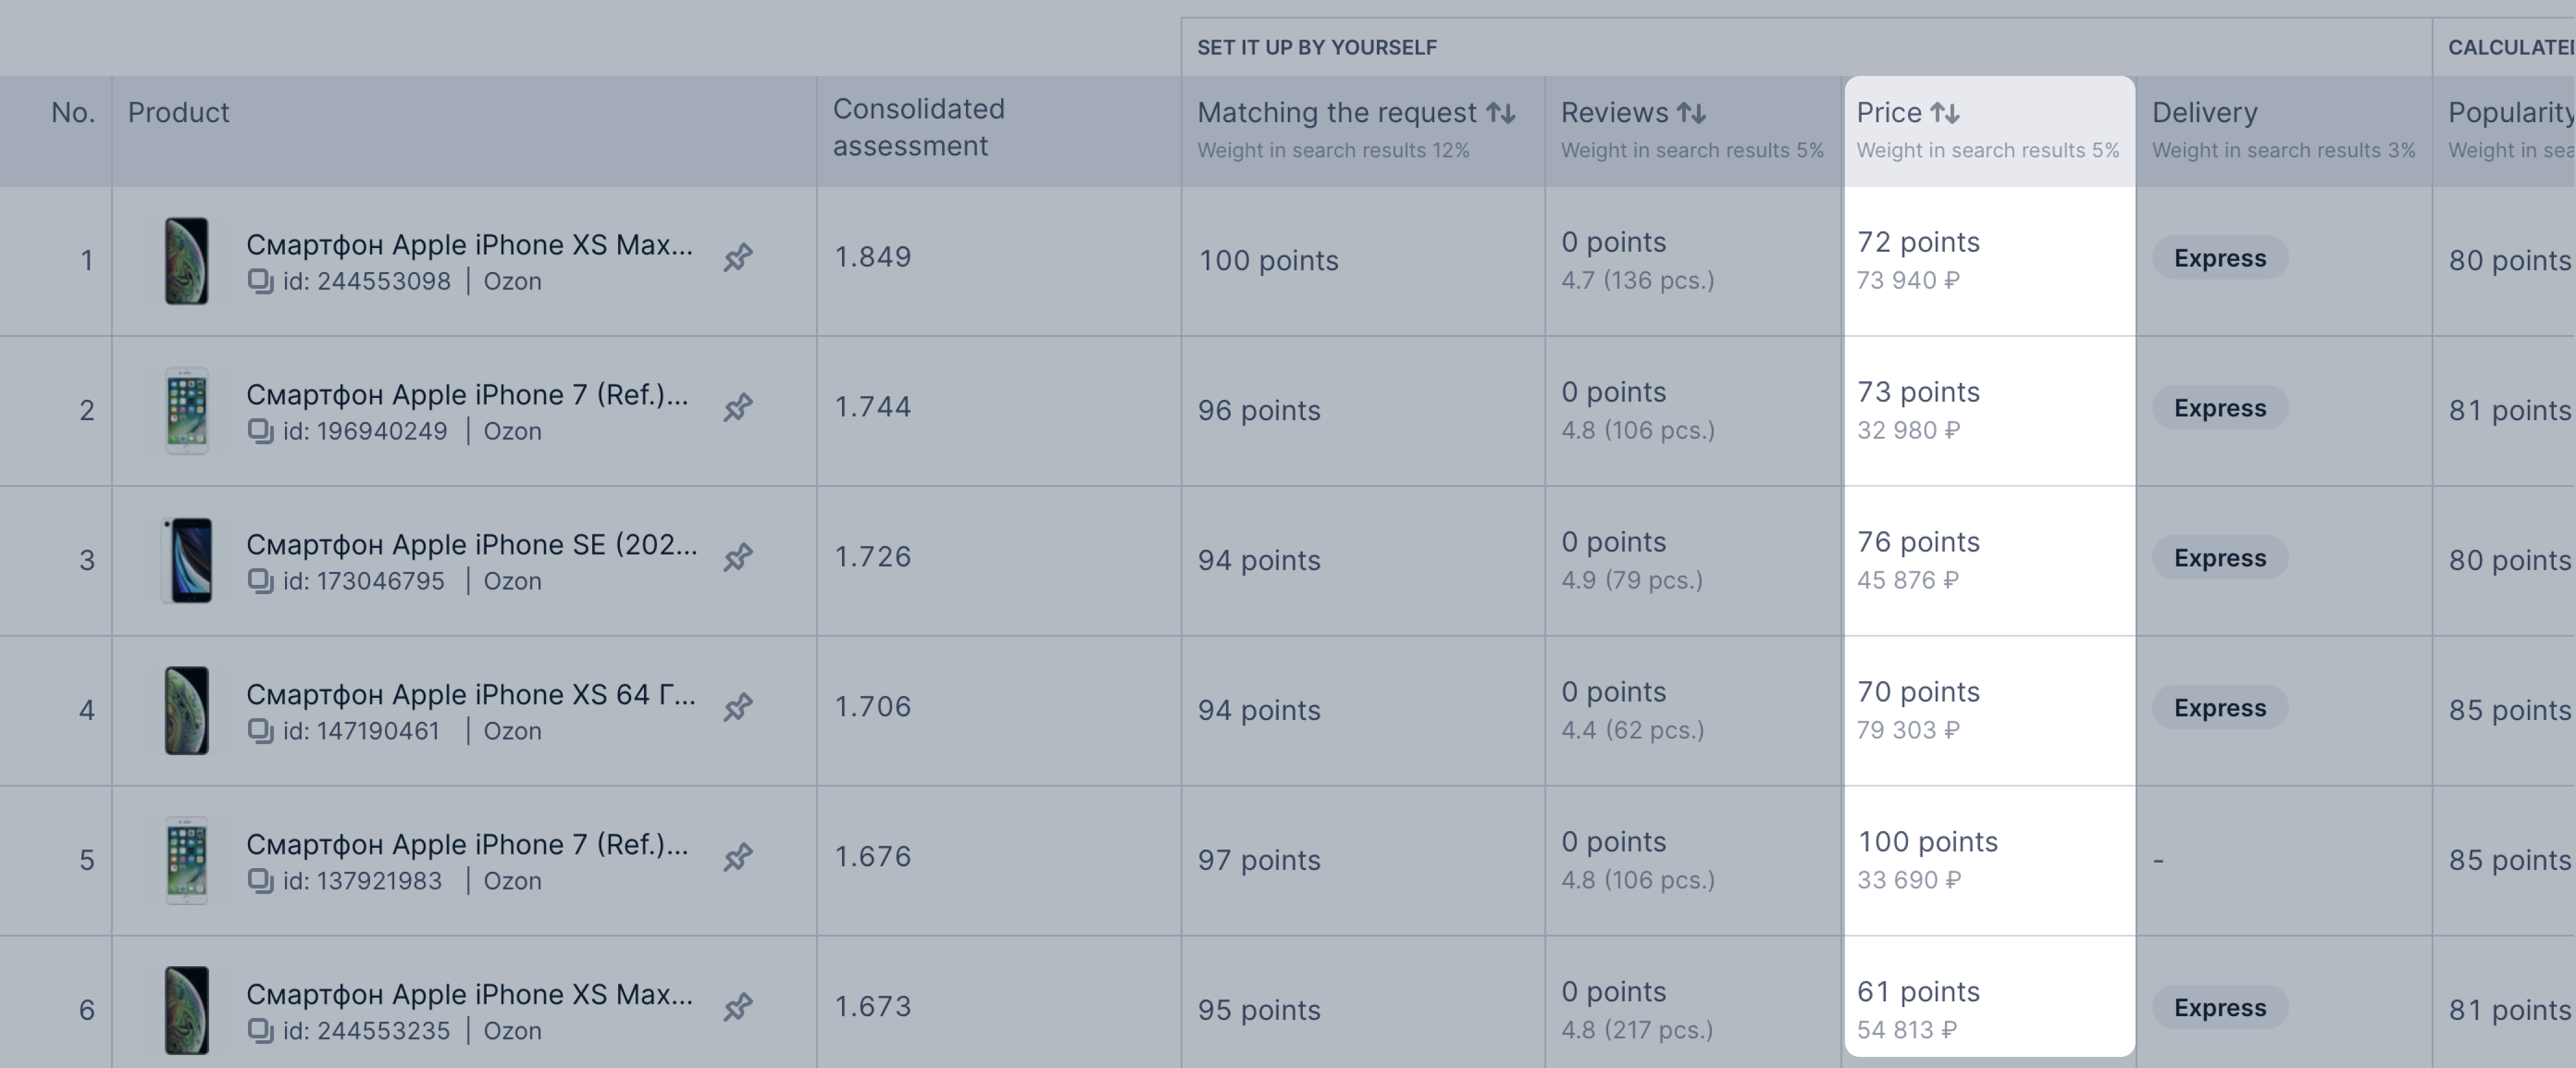
Parameter Weight in search results Description Matching the request 12% Whether the name, description, and other fields match the query. The more precisely the product matches the search phrase, the more points it gets Reviews 5% Formed from:
• average rating;
• number of reviews;
• the number of points the product received for the parameter. The better the rating and more reviews, the more points it gets.Price 5% Formed from:
• the price customers see with a discount;
• the number of point the product received for the parameter. The lower the price, the more points it gets. However, the calculation takes into account not only the final cost, but also other parameters.Delivery 3% The higher the delivery speed, the more points the product receives.
The speed depends on the operating scheme: the fastest is Express, the slowest is FBS. -
Calculated from other parameters: you can’t affect them directly.
Parameter Weight in search results Description Popularity by query 29% How often this query was used to view the PDP, purchase the product, add it to cart, favorites, and comparison. Product sales 17% How often product has been purchased in the last 60 days. The more sales a product has, the more points it gets. General popularity 10% How often the product was purchased, added to the cart, favorites, and comparison from other Ozon pages, how often it’s PDP was opened. The more popular the product, the more points it gets.
How metrics are calculated #
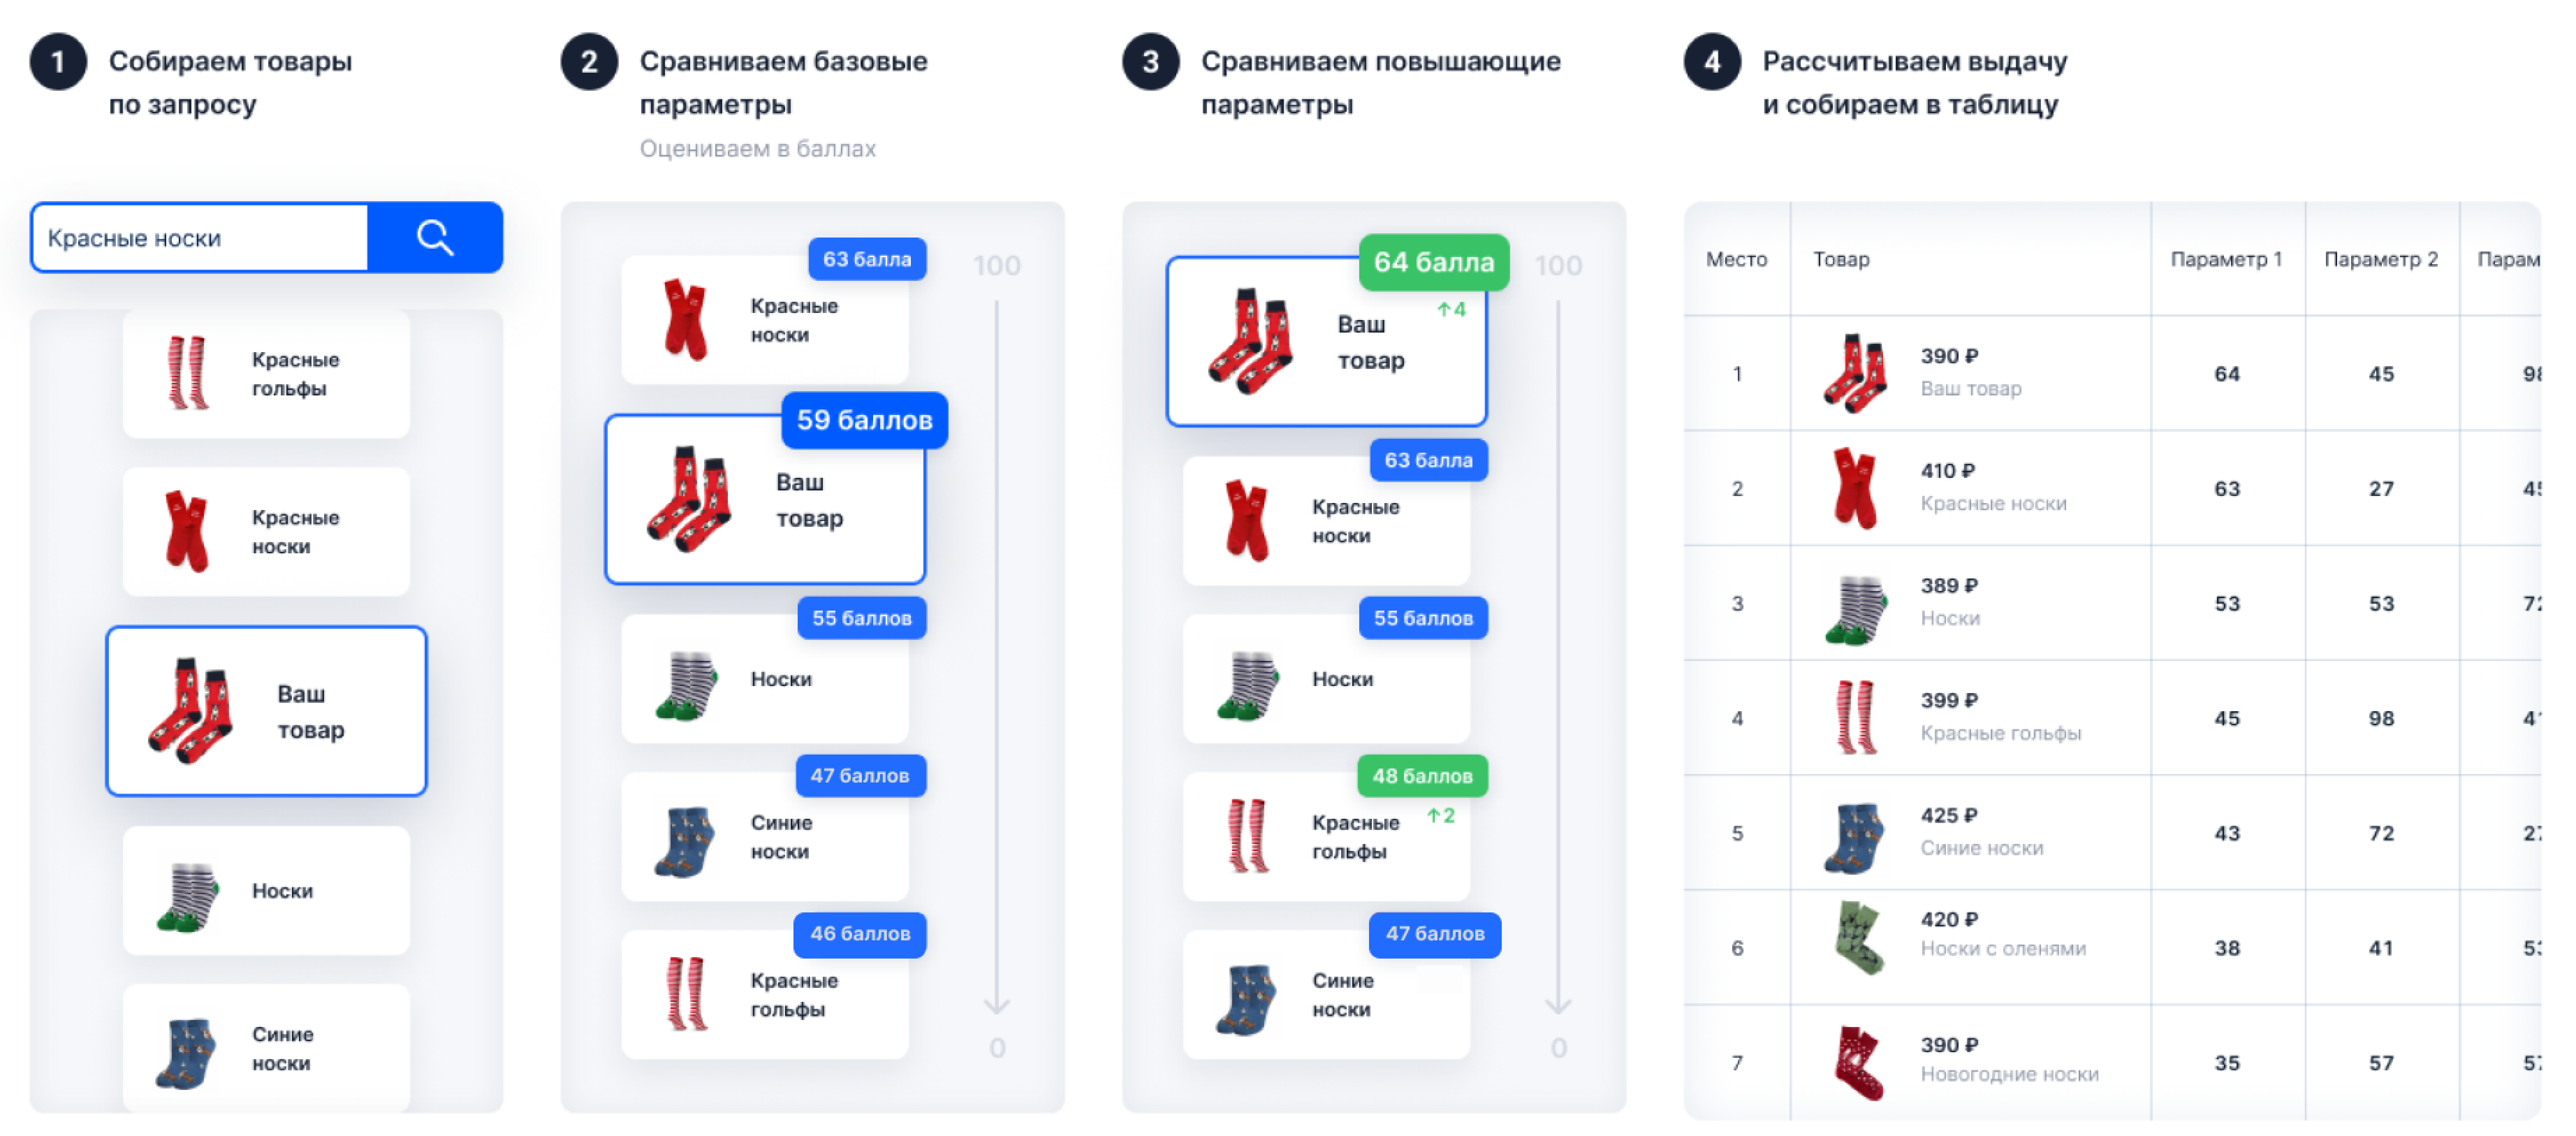
The metrics in the table are formed in several stages:
- Searching for products that have matches with the request in the:
- name,
- description,
- other fields.
- Calculating basic parameters. They form a summary rate and position in search results.
- Checking products for increasing coefficients.
They are optional, but they increase the summary rate and position.
If products have increasing coefficients, the summary rate is multiplied by the corresponding coefficient to get the final position in search results.
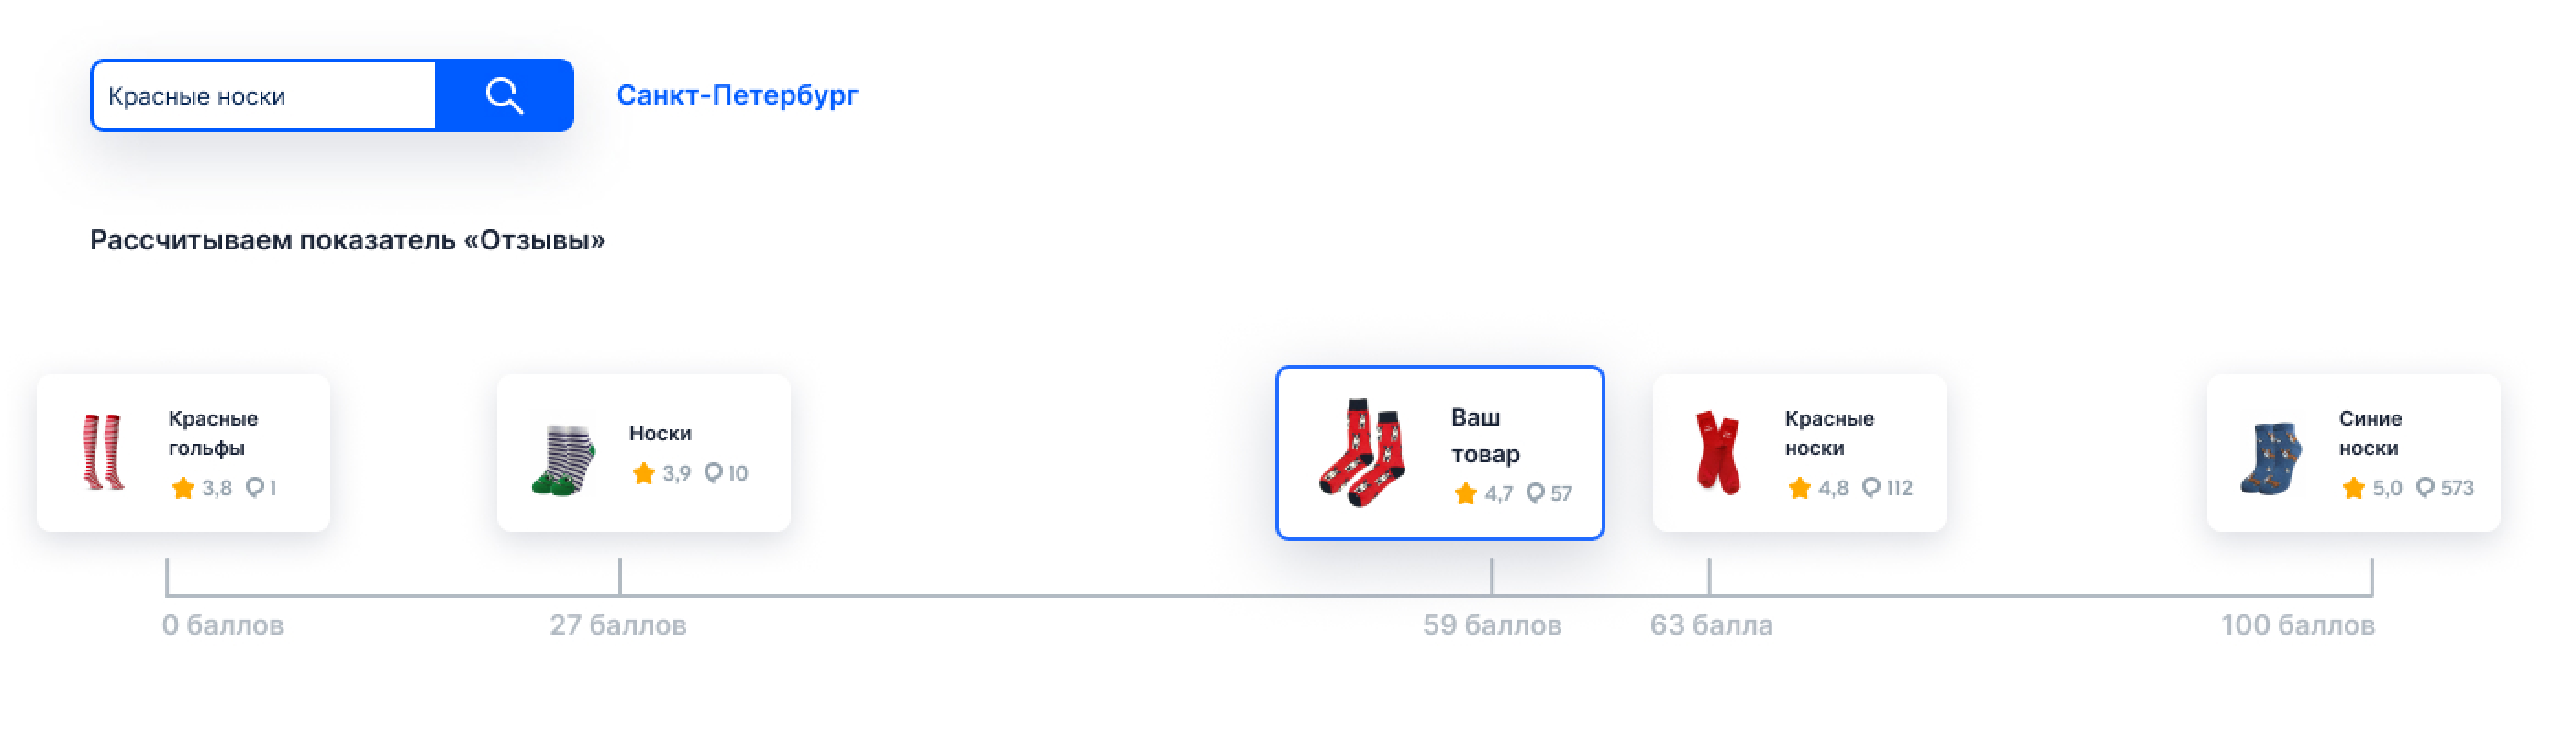
Basic parameters #
Metrics are calculated for products that match search queries. The obtained values are compared and the products are evaluated in points:
- the product with the highest score gets 100 points;
- with the lowest—gets 0;
- the algorithm assigns points to the remaining products by comparing each product rate with the resulting scale from 0 to 100.
Products with the same metrics may get a different number of points. Also, products with different metrics can be evaluated the same way, because points are calculated separately for each query.
To make products show higher, first pay attention to parameters with the highest weight.
Increasing coefficients #
Available increasing coefficients depend on the country you are selling from.
The increasing coefficients additionally raise the product position. They are optional. You decide whether to use them or not.
Each parameter has its own coefficient. Total product rating is multiplied by it to determine the final place in search results.
From February 14, 2023, the price index affects the place in search results. It’s taken into account in analytics, but not displayed in the table.
| Parameter | Raising | Description |
|---|---|---|
| Mega sales | Depends on the promotion | Product participation in Ozon promotions. For example, “Discount Marathon”, “11.11”, and “Black Friday”. |
| Fast delivery | • Domestic warehouse delivery for FBO: 50%; • realFBS Express: 52.5%; • Ozon Fresh: 52.5%. |
Domestic warehouse delivery for FBO: delivery from the Ozon warehouse, which is located in the customer’s region. RealFBS Express and Ozon Fresh: delivery in a few hours. |
Recommendations for working with products in the table #
Product order in the table may not match the order on the site. Many parameters affect search results, so customers from the same city see different results at the same time.
Pin the product in the first row #
If your product didn’t get to the top positions, pin it and compare with competitors.
Click
![]() next to the name of the necessary product.
next to the name of the necessary product.
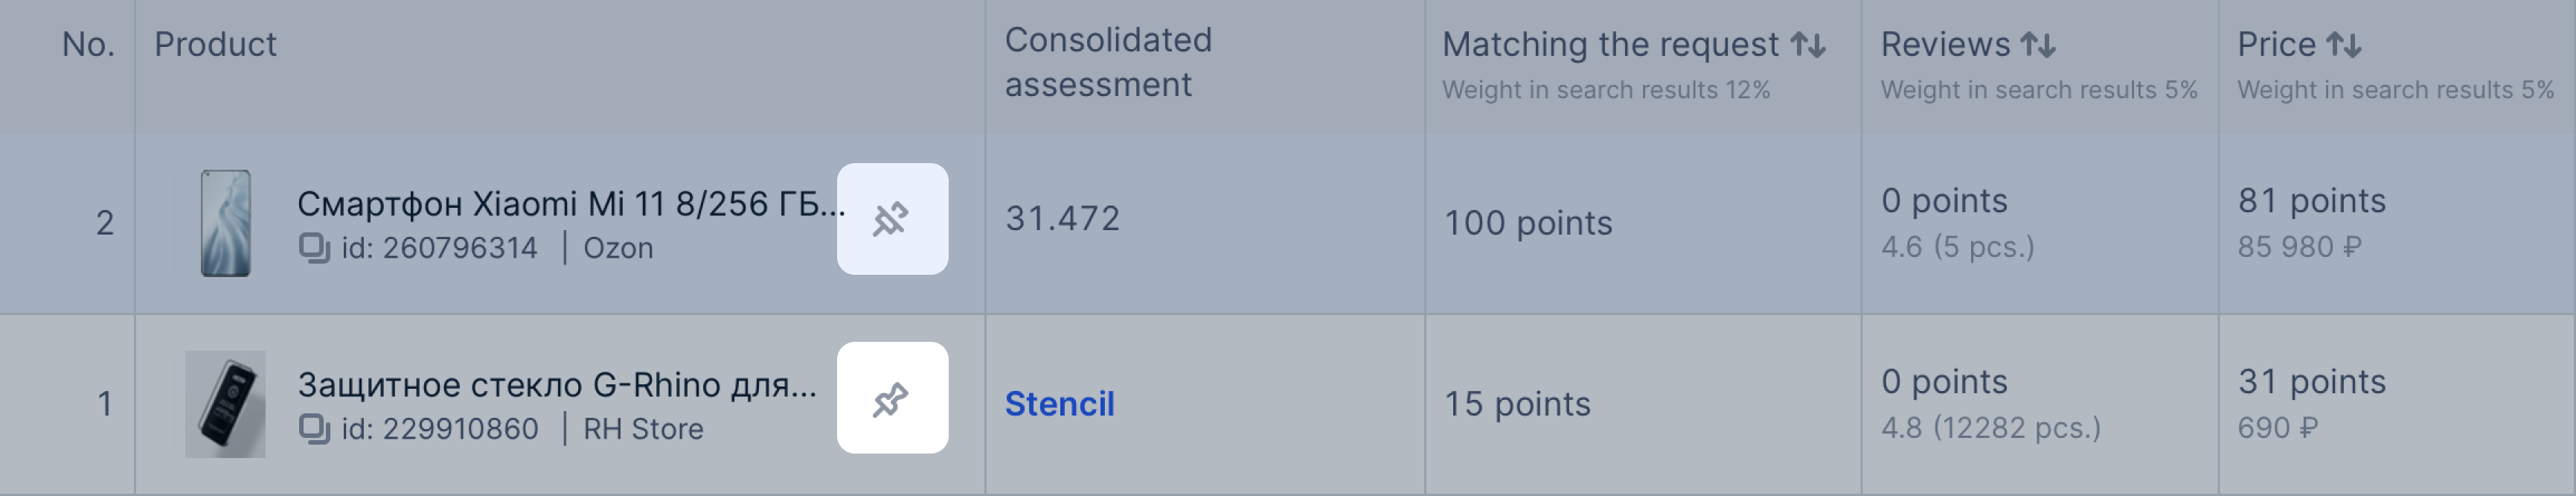
Hover your cursor over the product label to see what you can improve.
If your offers aren’t in the table, analyze the parameters of products in the first places.
To unpin the product, click
![]() .
.
Don’t compare points at different times #
Every time a customer searches for a product, the algorithms recalculate the item position anew, so the data in the table is constantly changing. The tool reflects the situation at the time of building the table.
Example
Your product has a low “Matching the request” metric. You’ve edited the PDP, its content rating has increased, but the metric in analytics has become lower.
Other sellers could improve the metric or return products with good parameters to sale while you were editing your product.
Don’t add up the parameter values #
Each parameter has its own weight in search results. For example, 40 points for reviews affect a position less than 40 points for sales.
Use increasing coefficients #
Available increasing coefficients depend on the country you are selling from.
Use increasing coefficients to raise products: launch sales from a domestic warehouse, enable fast delivery, or add products to promotions.